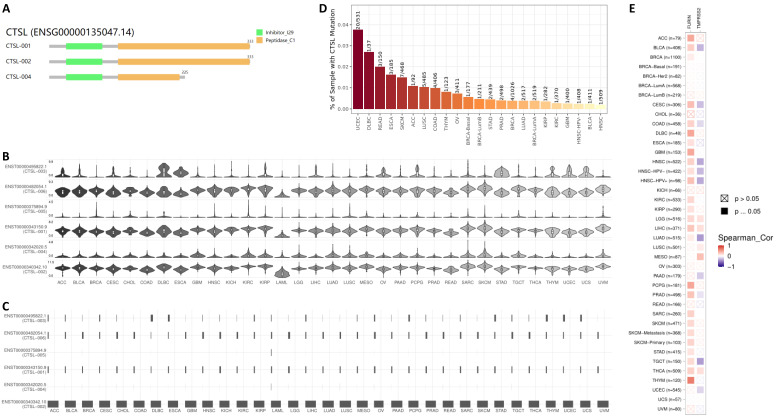
Figure 3.
The usage and the structure of CTSL isoforms in different types of cancers. A. Structure of CTSL isoforms is shown. Three isoforms and two visualized domains are shown in an interactive plot. Note: information for the following 3 isoforms are missing: ENST00000375894.9, ENST00000482054.1 and ENST00000495822.1. B & C. Usage of different CTSL isoforms. The profiles for the distribution of CTSL expression are shown with violin plot in panel B, and isoform usage is shown with bar plot in panel C. The X axis presents isoforms, whereas the Y axis presents the respective cancer types. D. Mutation status for CTSL in different tumors from TCGA. E. The heat maps show the log2 fold expression changes of FURIN and TMPRSS2 in each tumor type. The full names of cancers are shown in right panel of Figure 6.

