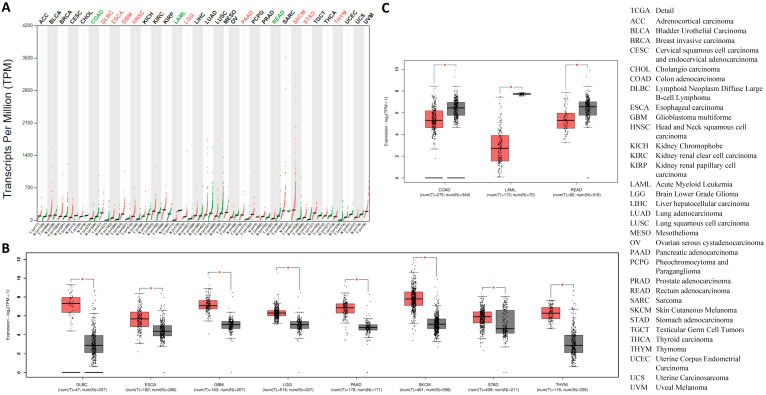
Figure 5.
The expression of CTSL in tumor tissues and the corresponding normal tissues. A. CTSL expressions in 33 types of cancer tissues (red files) and the corresponding normal tissues (green files). Green in names indicates decreased expression whereas red in names indicates decreased expression in cancer tissues compared to the corresponding normal tissues. B. Expression profiles for CTSL in eight tumor tissues and their corresponding normal tissues. C. Expression profiles for CTSL in three tumor tissues and their corresponding normal tissues (*: p<0.01). The cancer tissue is in red, the normal tissue is in grey. Tissue-wise expressions are used as box plots. Right panel shows the cancerous full names.

