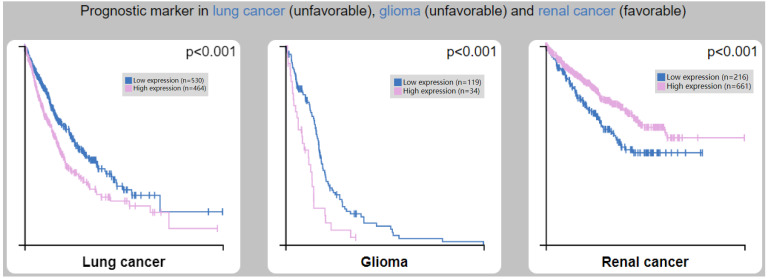
Figure 7.
Correlation between CTSL expression and overall survival (OS) in patients with lung cancer (left panel), glioma (middle panel) and renal cancer (right panel). Note: Based on the FPKM (Fragments Per Kilobase Million) value of the CTSL gene, cancer patients were classified into two groups (high and low expression) and the correlations between expression level and patient survival were evaluated.

