Figure 8.
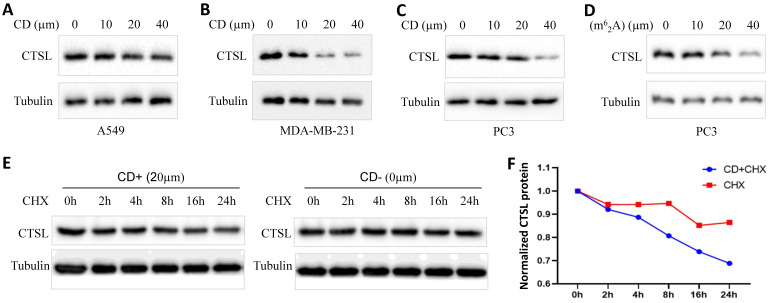
CD or m62A suppresses CTSL expression in cancer cell lines. A. CTSL protein levels after CD treatment in A549 lung cancer cell line. B. CTSL protein levels after CD treatment in MDA-MB-231 triple-negative breast cancer cell line. C. CTSL protein levels after CD treatment in PC3 prostate cancer cell line. D. CTSL protein levels after N6, N6-dimethyladenosine (m62A) treatment in prostate cancer cell line PC3. E. CTSL protein stability after CHX treatment with or without CD treatment. Left panel shows CD treatment, right panel shows without CD treatment. F. The quantitative results from E. Red line shows CHX treatment only, blue line shows CHX treatment together with CD treatment. The final concentration for CHX treatments were 40 µg/ml.

