Figure 4.
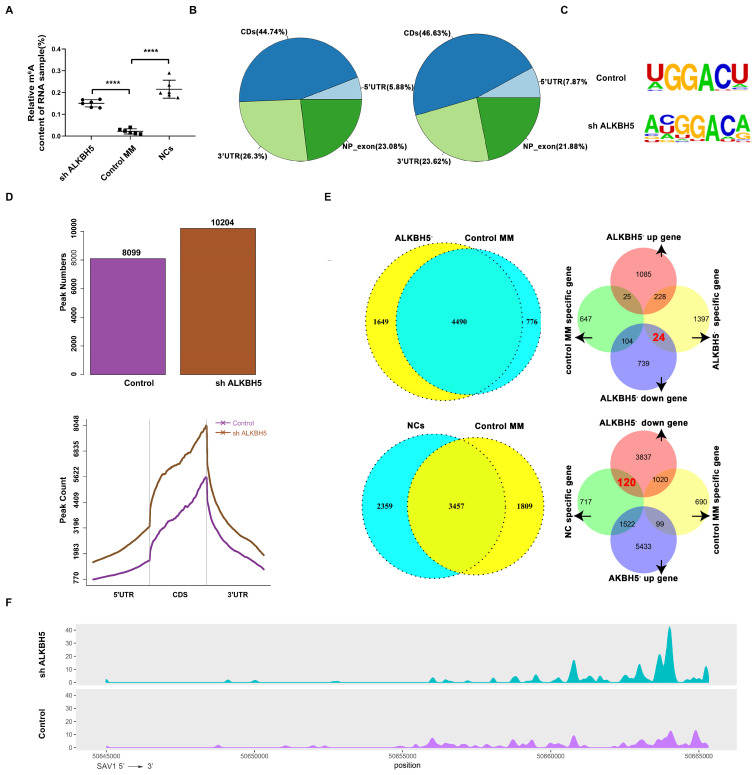
Features of the m6A methylome and mRNA level changes in ALKBH5- and control RPMI8226 cells. (A) Relative m6A content of the RNA in the ALKBH5-, control RPMI8226 cells and the NCs. (B) Charts of the m6A peak distribution indicating the proportion of peaks in different regions of the ALKBH5- and control RPMI8226 cells. (C) The m6A consensus motif in ALKBH5- and control RPMI8226 cells was analysed by HOMER. (D) m6A peak counts representing the ALKBH5- and control RPMI8226 cells were identified by MeRIP-seq. (E) The measurement of genes that changed in a m6A manner in ALKBH5-, control RPMI8226 cells and CD138+ cells from healthy volunteers (NCs). 24 genes were downregulated in 1649 ALKBH5--specific genes and 120 genes were downregulated in NC-specific genes. (F) Tracks of m6A modifications of SAV1 mRNA in the ALKBH5- and control RPMI8226 cells.

