Figure 8.
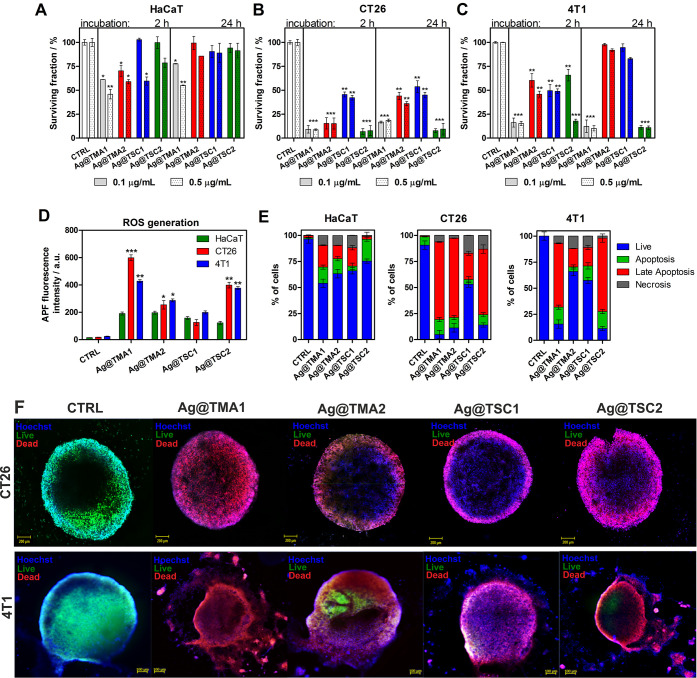
Cytotoxicity of AgNPs against (A) HaCaT, (B) CT26, and (C) 4T1 cells; in vitro ROS generation determined by APF fluorescence signals (D), determination of the mechanism of AgNPs-induced cell death determined by flow cytometry analysis of cells stained with Annexin V-FITC for apoptosis detection and PI for necrosis, respectively (E), and AgNPs efficacy against the 3D tumor spheroid model. Spheroids were treated with AgNPs and stained with Hoechst33342 (nuclei, blue fluorescence), Calcein AM (live cells, green fluorescence), and PI (dead cells, red fluorescence); scale bar—100 μm (F). Data are expressed as mean ± SEM (*** P-value < 0.001, ** P-value < 0.01, and * P-value < 0.5).

