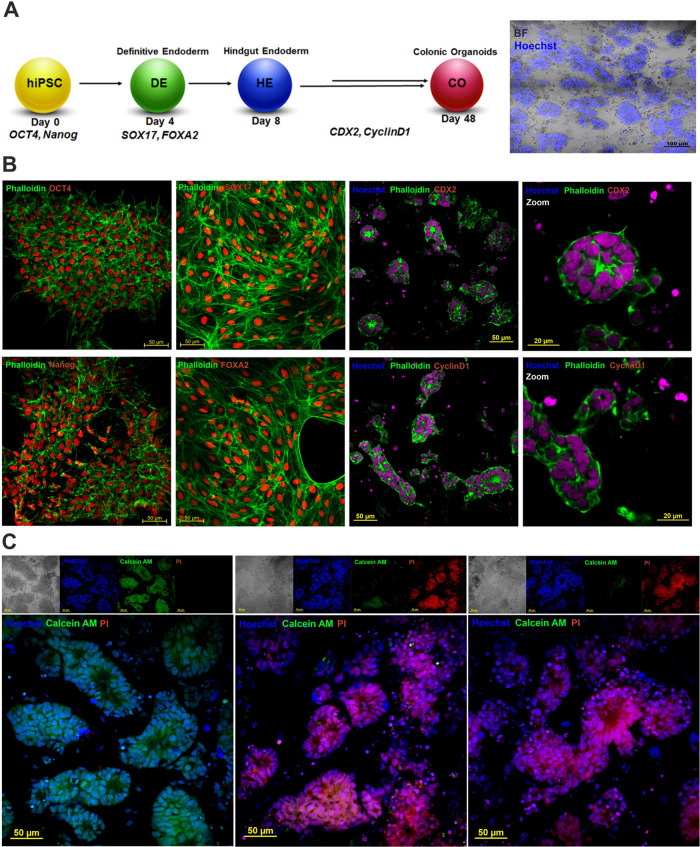
Figure 9.
(A) Scheme illustrating the differentiation of iPSC to iPSC-derived colonic organoids, (B) pluripotency and colonic tissue markers staining: phalloidin—green, OCT-4, SOX17, Nanog, FOXA2, CDX2 and cyclin D1—red, and Hoechst 33342—blue; scale bars—50 μm, and (C) live/dead staining of colonic organoids after treatments with AgNPs: Calcein AM—green, PI—red, and Hoechst 33342—blue, scale bars—50 μm.

