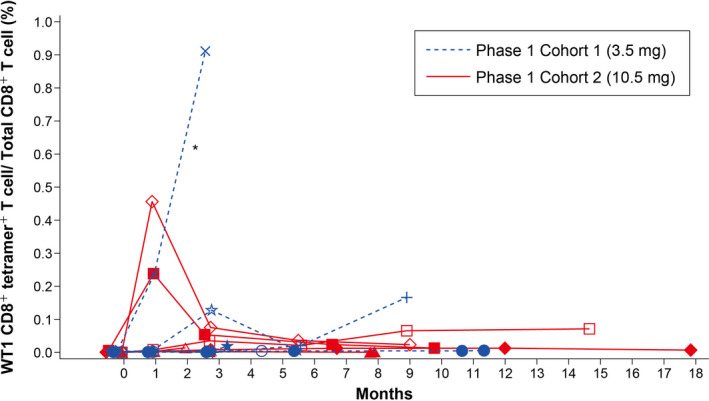
FIGURE 8.

Individual plot of CTL induction with WT1 vaccine: Phase 1. *One patient in Cohort 1 (3.5 mg) was not evaluable because an accurate measurement of WT1 CD8+ tetramer+ by flow cytometry was hampered by background fluorescence. CTL, cytotoxic T lymphocyte; WT1, Wilms’ tumor gene 1
