
FIGURE 1.
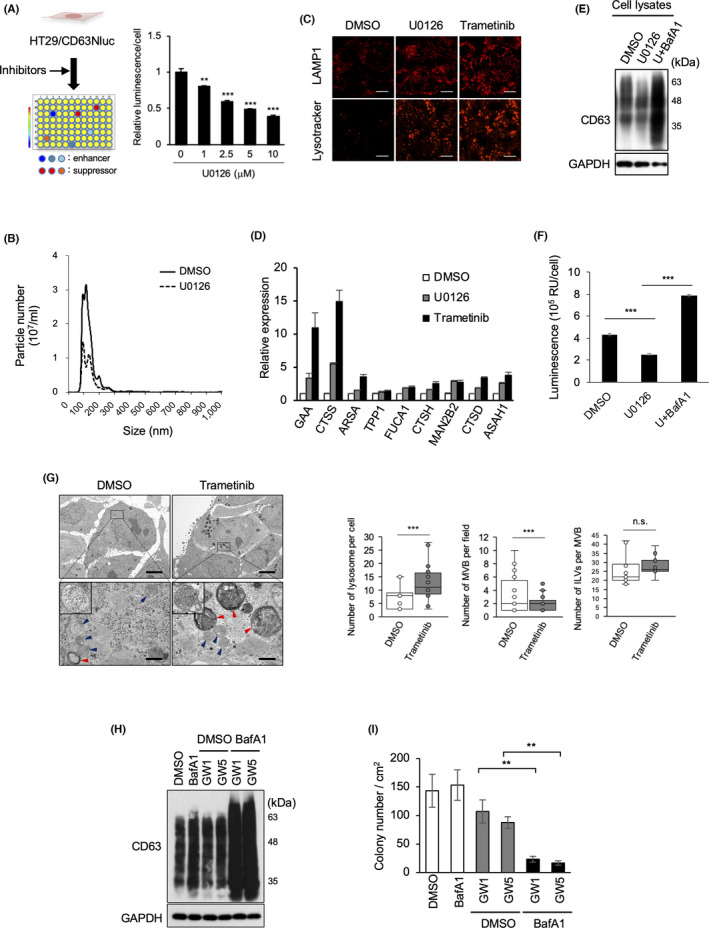
MEK/ERK activation promotes EV secretion and impairs lysosome function. (A) Schematic representation of the selection of EV inhibitors. After CD63Nluc‐expressing HT29 cells (HT29/CD63Nluc) were treated with signaling inhibitors, luminescence in the culture medium was analyzed. Relative luminescence normalized by cell viability in the presence for 24 h of the MEK inhibitor U0126 at the indicated concentrations. (B) HT29 cells treated with or without U0126 for 24 h were used for EV preparation followed by nanoparticle tracking analysis of isolated particles. (C) HT29 cells were treated with DMSO, 10 μM U0126, or 100 nM trametinib for 24 h, and then subjected to immunostaining for anti‐LAMP1 and Lysotracker Red DND‐99. Scale bars, 10 μm. (D) Expression analysis of lysosomal genes in cells used in (C). (E) Total cell lysates from HT29 cells treated with DMSO, 10 μM U0126, 10 μM U0126, or 50 nM bafilomycin A1 (BafA1) for 24 h were immunoblotted with the indicated antibodies. (F) HT29/CD63Nluc cells were treated with DMSO or 10 μM U0126, and 50 nM bafilomycin A1 for 24 h, luminescence in the culture medium was analyzed. (G) Electron microscopy images of MVBs (blue arrowheads) and lysosomes (red arrowheads) in HT29 cells treated with DMSO or trametinib (100 nM) for 24 h are presented in upper panels with a scale bars representing 5 μm. Boxed areas with dotted line are enlarged at lower panels with a scale bar of 500 nm. High magnification pictures of MVB are shown in insets of lower panels. Quantification of number of lysosomes per cell (n = 17: DMSO, n = 25: trametinib), MVBs in more than 21 fields per condition, and ILVs per MVB (n ≥ 14). Boxes represent the interquartile range and line inside the box represents median value. (H) Total cell lysates from HT29 cells treated for 48 h with 1 nM BafA1, and/or GW4869 (GW) at 1 or 5 μM were immunoblotted with the indicated antibodies. (I) HT29 cells treated with DMSO, or 1 nM BafA1, and/or GW at 1 or 5 μM were used for the soft‐agar colony formation assay. Relative colony numbers obtained from 3 independent experiments are shown. Data are represented as means ± standard deviation of 3 independent measurements. Statistical analysis was performed using one‐way ANOVA. **p < 0.01, ***p < 0.001; n.s., not significant