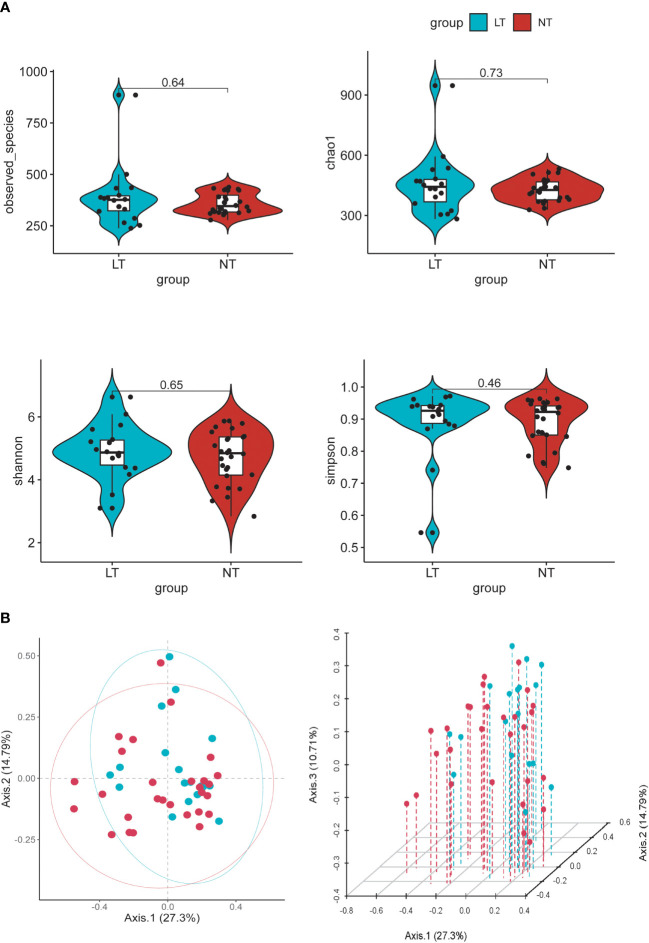
Figure 2.
Alpha and beta diversity of the gut microbial communities from participants. (A) Comparison of observed OUT Numbers, chao1, shannon and simpson indexes between two groups. (B) Principal coordinate analysis (PCoA) of fecal microbiota, each dot represents the bacterial community composition of one individual stool sample, and the axis titles indicates the percentage variation explained (27.3% and 14.79 %, respectively).

