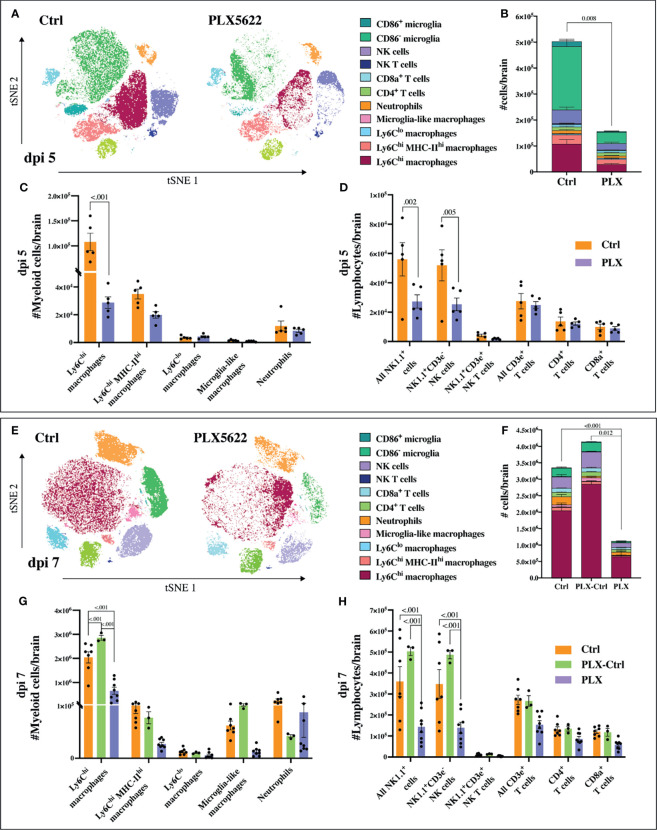
Figure 3.
PLX5622 reduces leukocyte influx into WNV-infected brains. (A) tSNE plot clustered on CD45+ brain cells from dpi 5 PLX and Ctrl mice. (B) Stacked bar graph showing the number of brain cells in PLX and Ctrl mice at dpi 5. (C, D) Number of myeloid (C) or lymphoid (D) cells in brains of mice culled at dpi 5. (E) tSNE plot clustered on CD45+ brain cells from PLX and Ctrl mice at dpi 7. (F) Stacked bar graph showing the number of brain cells at dpi 7. (G, H) Number of myeloid (G) or lymphoid (H) cells at dpi 7 in brains of PLX, PLX-Ctrl and Ctrl mice. Data is presented as mean ± SEM from one (dpi 5 data) or two (dpi 7 data) independent experiments with at least three mice per group.

