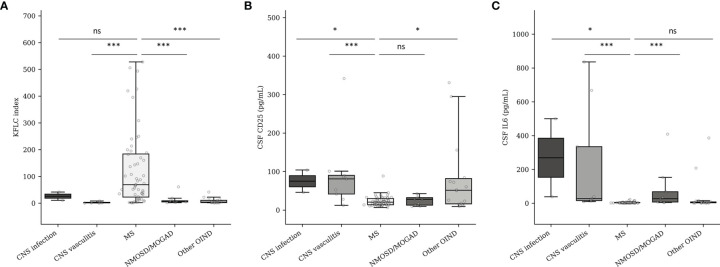
Figure 3.
KFLC index (A), CSF CD25 (B), and CSF IL-6 (C) expression in MS and OIND subgroups. CNS, central nervous system; MS, multiple sclerosis; MOGAD, myelin oligodendrocyte antibody-associated disorder; NMOSD, neuromyelitis optica spectrum disorder; OIND, other inflammatory neurological disorder. Number of patients according to the different subgroups: CNS infection (n = 2), CNS vasculitis (n = 9), MS (n = 58), NMOSD/MOGAD (n = 9), OIND (n = 15). ns, non-significant (p > 0.05). *p < 0.05. ***p < 0.001.

