Figure 5.
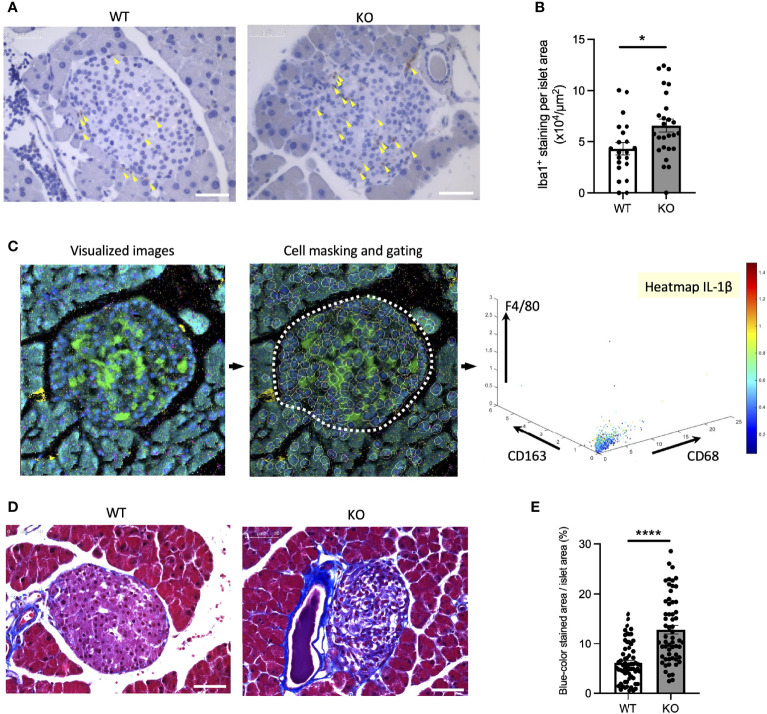
Macrophage infiltration and fibrosis in the Wolfram syndrome mouse model islets. (A) Iba1 DAB staining of the islets from Wfs1 wild-type (WT) and whole-body knockout 129S6 (KO) male mice at 10 months of age. Yellow arrowheads point to the stained macrophages. Scale bars 50 µm. (B) The number of Iba1 positive cells was normalized to each islet’s area size (WT, n=21; KO, n=28). (C) Left panel: Visualized imaging mass cytometry (IMC) image of KO male mouse stained with F4/80 (red), insulin (green), DNA (blue), CD68 (magenta), and CD163 (yellow). Contrast staining was performed with Ruthenium (cyan). Middle panel: cells were masked, and the islet area was gated. Right panel: Scatter plot of F4/80, CD163, and CD68. IL-1β was shown in the heatmap. (D) Trichrome-Masson staining of the islets from WT and KO male mice at 10 months of age. Collagen fibers are stained in blue. Scale bars 50 µm. (E) The blue-colored area was normalized to each islet’s area size (WT, n=33; KO, n=34). Data are shown in mean ± SEM, *P < 0.05, ****P < 0.001.

