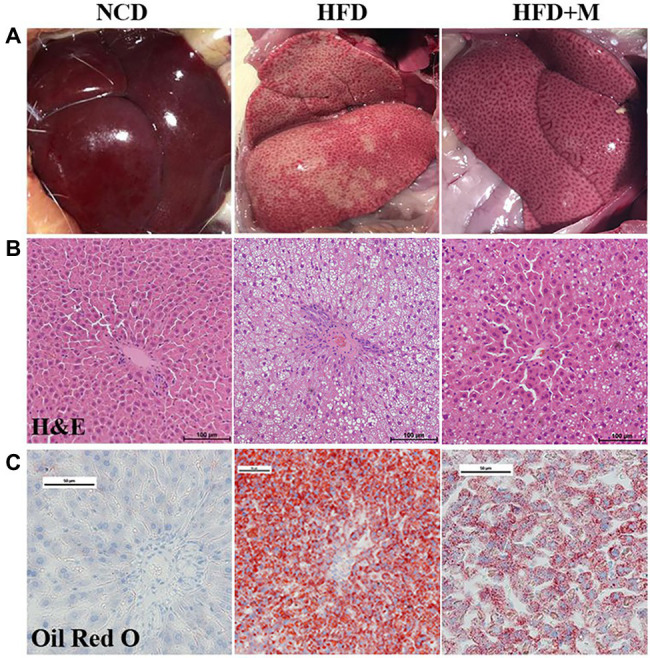
Figure 6.

Changes in hepatic steatosis after fecal microbiota transplantation. (A) Photos showing liver morphology. (B) H and E staining of liver section. Scale bars, 100 μm. (C) Liver Oil Red O staining. NCD, Normal Chow Diet rats; HFD, HFD rats; HFD + M, HFD rats received fecal microbiota transplant from HFD-T monkeys. Scale bars, 50 μm.
