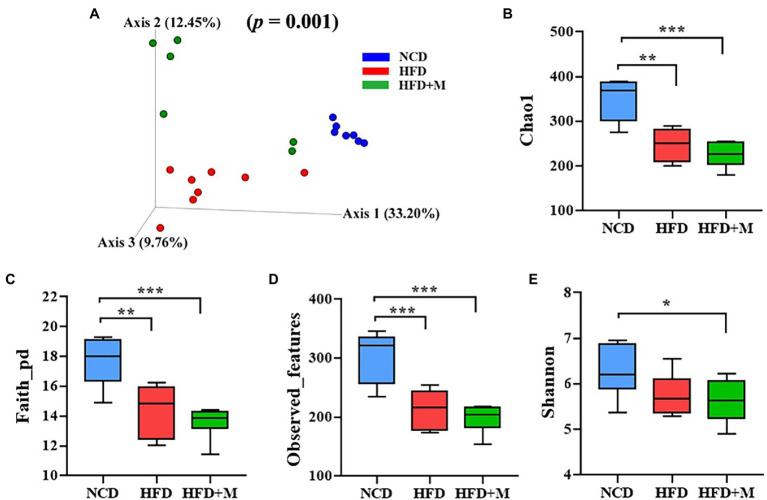
Figure 7.
The beta diversity, structure, and richness of the gut microbiota in three groups of rats. (A) Nonmetric multidimensional scaling (NMDS) score plot based on principal component analysis (PCA) score plot based on microbiota composition. (B–E) The gut microbiota diversity as calculated using Shannon’s index (B), Chao1 (C), Faith-pd (D), and observed-features (E) index of each rat group: NCD, Normal Chow Diet (control) rats; HFD, HFD rats; HFD + M, HFD rats received fecal microbiota transplant from HFD-T monkeys. Values are presented as mean ± SE. (n = 7). *, p < 0.05; **, p < 0.01; ***, p < 0.001, compared with NCD rats.

