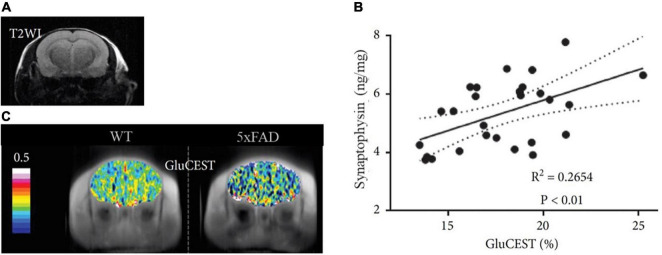
FIGURE 5.
Representative images of GluCEST MRI of a 5xFAD and a WT mouse. (A) Structural T2-weighted image (T2WI) in the coronal plane. (B) GluCEST maps of the corresponding T2WI showing reduced GluCEST effects in an aged (7-month old) 5xFAD mouse compared with the WT. (C) Correlation between GluCEST and Synaptophysin concentration. Figure extracted and modified from Igarashi et al. (2020).

