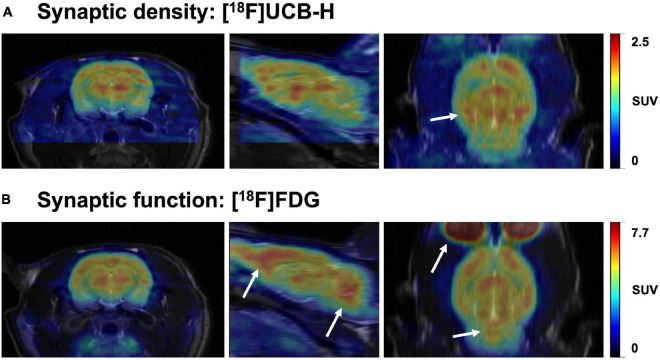
FIGURE 6.
Representative brain images comparing synaptic density and function in the same rat. The images represent the uptake of two radiotracers: (A) [18F]UCB-H (concentration of SV2A protein, synaptic density marker) and (B) [18F]FDG (glucose metabolism, synaptic function marker). Both images were acquired 40-60 min after intravenous radiotracer injection (36 and 20 MBq, respectively). Scans were performed 24h apart, followed by a T2-weighted MR image to allow a better comparison between both PET scans through manual rigid-body co-registration with PMOD software. The white arrows represent the main differences in uptake between both radiotracers. While synaptic density and function are similar in multiple brain areas, regions such as the prefrontal cortex and cerebellum seem to have relatively higher glucose metabolism (synaptic function) than concentration of SV2A (synaptic density). Images obtained at GIGA-CRC in vivo imaging, ULiège (Belgium).

