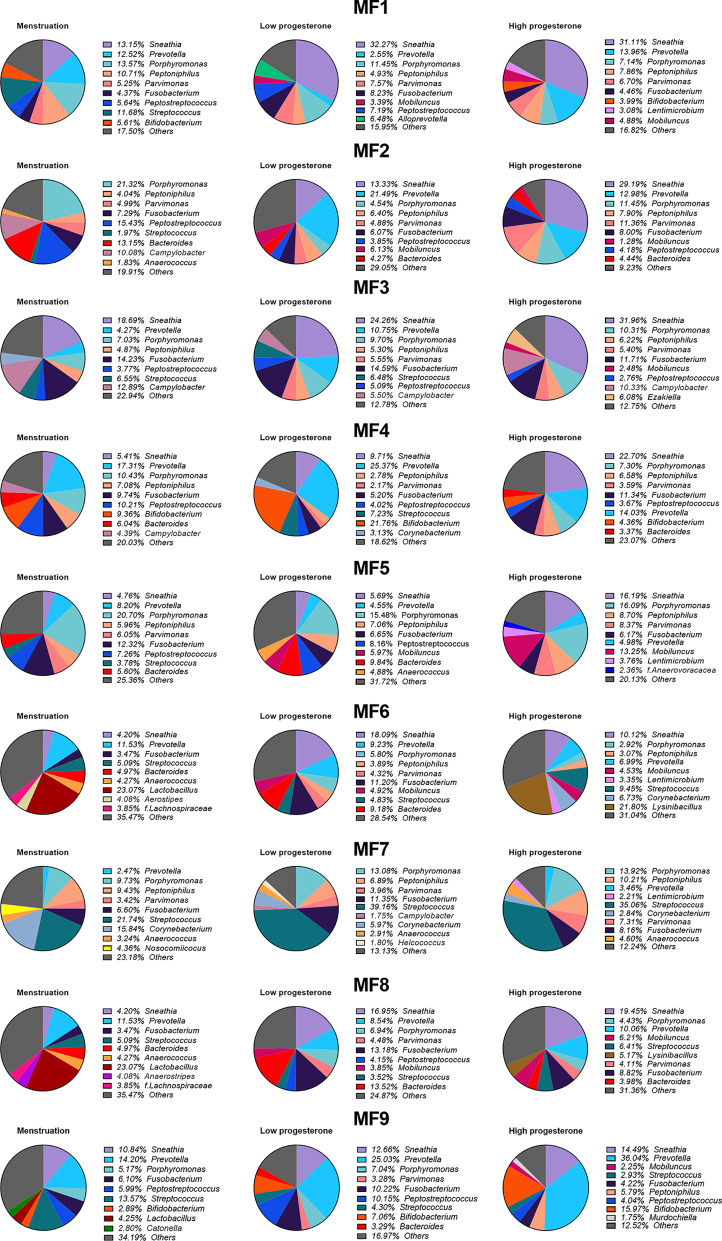
Figure 7.
Variation of bacterial taxa during each phase of the menstrual cycle. Percentage of the mean relative abundance of the nine most represented genera in the high-progesterone, low-progesterone, and menstruation groups is represented in a pie chart for each female. Other genera are shown in grey (other).

