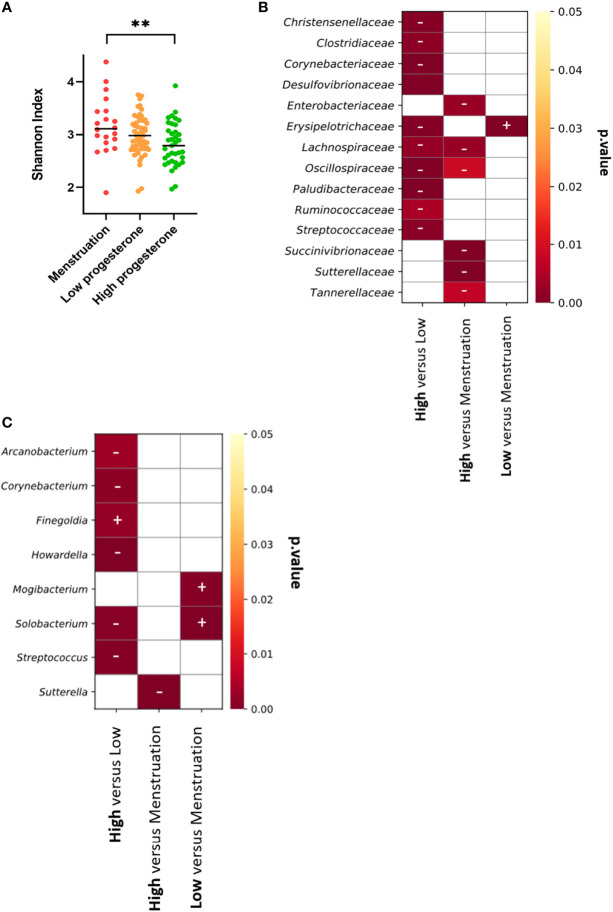
Figure 8.
Vaginal microbiota diversity and differentially abundant bacterial taxa in each phase of the menstrual cycle. (A) The Shannon index was calculated for each female for the high-progesterone and low-progesterone phases and during menstruation and plotted together. A Kruskal-Wallis test followed by Dunn’s test to adjust the p value was performed (**p ≤ 0.01). Analyses were performed using the FitZIG algorithm at the family (B) or genus (C) level. Heatmaps representing the p values were generated and plus and minus signs were added to visualize increases or decreases in the abundance of each bacterial taxa. The sign is associated with the group in bold text. As an example: the abundance of Christensenellaceae was higher during the high-progesterone phase than the low-progesterone phase.

