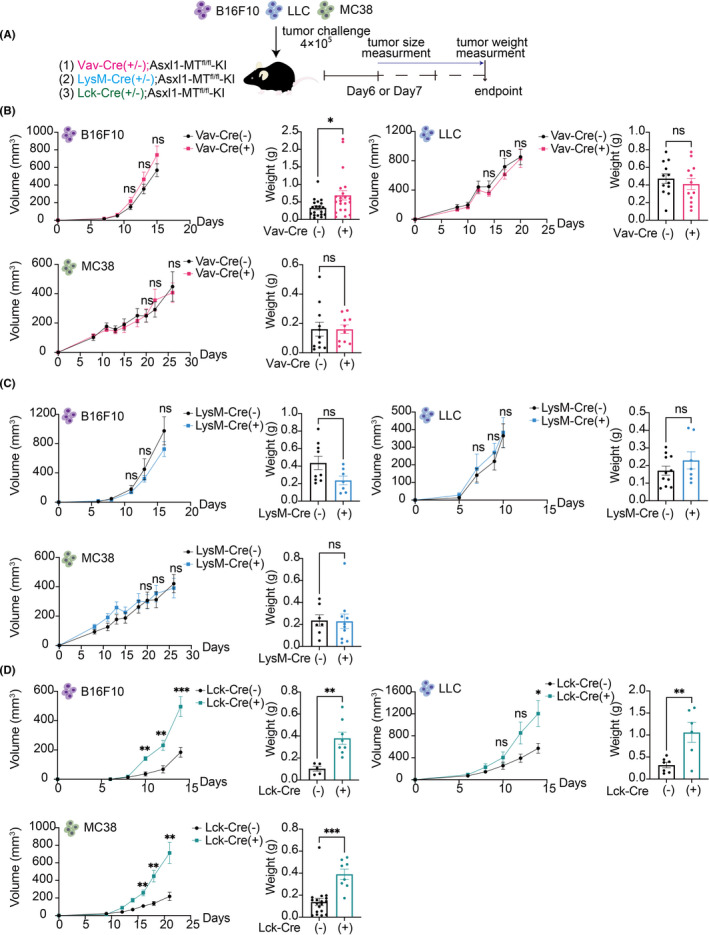
FIGURE 1.

Increased growth of multiple solid tumors in Lck‐Cre; Asxl1‐MTfl/fl mice. A, Schematic diagram of the syngeneic mouse models. Cre(−) and Cre(+) indicate Cre(−/−) and Cre(+/−), respectively. B, The growth curves of tumor volumes (mm3) and endpoint weights (g) of B16F10 [Vav‐Cre(−): n = 33, Vav‐Cre(+): n = 26], LLC [Vav‐Cre(−): n = 12, Vav‐Cre(+): n = 12), and MC38 [Vav‐Cre(−): n = 12, Vav‐Cre(+): n = 10] in control and Vav‐Cre; Asxl1‐MTfl/fl mice. C, The growth curves of tumor volumes and endpoint weights of B16F10 [LysM‐Cre(−): n = 10, LysM‐Cre(+): n = 6], LLC [LysM‐Cre(−): n = 16, LysM‐Cre(+): n = 8], and MC38 [LysM‐Cre(−): n = 7, LysM‐Cre(+): n = 11) in control and LysM‐Cre‐Asxl1‐MTfl/fl mice. D, The growth curves of tumor volumes and endpoint weights of B16F10 [Lck‐Cre(−): n = 5, Lck‐Cre(+): n = 8], LLC (Lck‐Cre(−): n = 7, Lck‐Cre(+): n = 6), and MC38 (Lck‐Cre(−): n = 22, Lck‐Cre(+): n = 8) in control and Lck‐Cre; Asxl1‐MTfl/fl mice. All data are shown as mean ± SEM. Multiple unpaired t test with Welch correction was used for the tumor volumes. Unpaired t test was used for the comparison of the endpoint weights. Two or three independent experiments using littermate mice were performed in a blind manner
