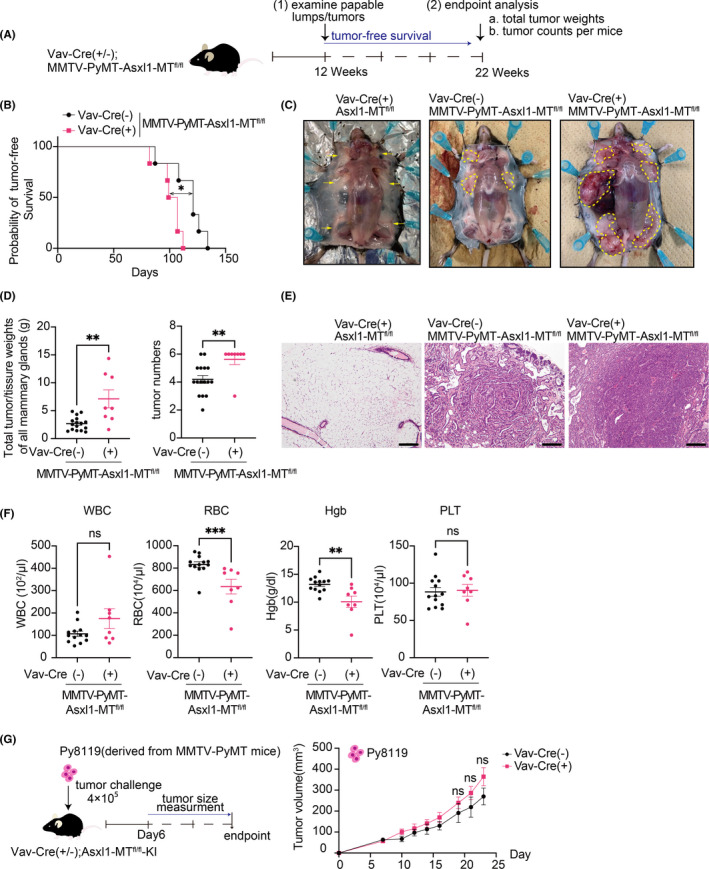
FIGURE 2.

Development of spontaneous mammary tumors was promoted in Vav‐Cre; Asxl1‐MTfl/fl mice. A, Schematic diagram of the spontaneous mammary tumor model. B, Tumor‐free survival curves of MMTV‐PyMT‐Asxl1‐MTfl/fl (n = 6) and Vav‐Cre; MMTV‐PyMT‐Asxl1‐MTfl/fl (n = 6) mice. Log‐rank (Mantel‐Cox) test was used for comparison. C, Representative pictures of the mammary glands. Left: Vav‐Cre; Asxl1‐MTfl/fl mice. Middle: MMTV‐PyMT‐Asxl1‐MTfl/fl mice. Right: Vav‐Cre; MMTV‐PyMT‐Asxl1‐MTfl/fl mice. Yellow arrows indicate mammary glands, and the tumors were circled with yellow dotted lines. D, Left: total tumor/tissue weights of all mammary glands per mouse (MMTV‐PyMT‐Asxl1‐MTfl/fl: n = 16, Vav‐Cre; MMTV‐PyMT‐Asxl1‐MTfl/fl: n = 10). Right: numbers of tumors per mouse (MMTV‐PyMT‐Asxl1‐MTfl/fl: n = 16, Vav‐Cre; MMTV‐PyMT‐Asxl1‐MTfl/fl: n = 8). E, Representative pictures of H&E staining of the mammary glands in Vav‐Cre; Asxl1‐MTfl/fl (left), MMTV‐PyMT‐Asxl1‐MTfl/fl (middle), and Vav‐Cre; MMTV‐PyMT‐Asxl1‐MTfl/fl (right) mice at day 148. The scale bar is 200 μm F, Complete blood count (CBC) of peripheral blood collected from the mice at their endpoint (MMTV‐PyMT‐Asxl1‐MTfl/fl: n = 13, Vav‐Cre; MMTV‐PyMT‐Asxl1‐MTfl/fl: n = 8). Hgb, hemoglobin; PLT, platelet; RBC, red blood cells; WBC, white blood cells.. Data are shown as mean ± SEM. Mann Whitney t test was used for the comparison. G, Schematic diagram of the syngeneic mouse models (left). Mice were sacrificed at day 24. The growth curves of tumor volumes (mm3) of Py8119 [Vav‐Cre(−): n = 9, Vav‐Cre(+): n = 10] in control and Vav‐Cre; Asxl1‐MTfl/fl mice (Right). Data are shown as mean ± SEM. Multiple unpaired t test with Welch correction was used for the tumor volumes
