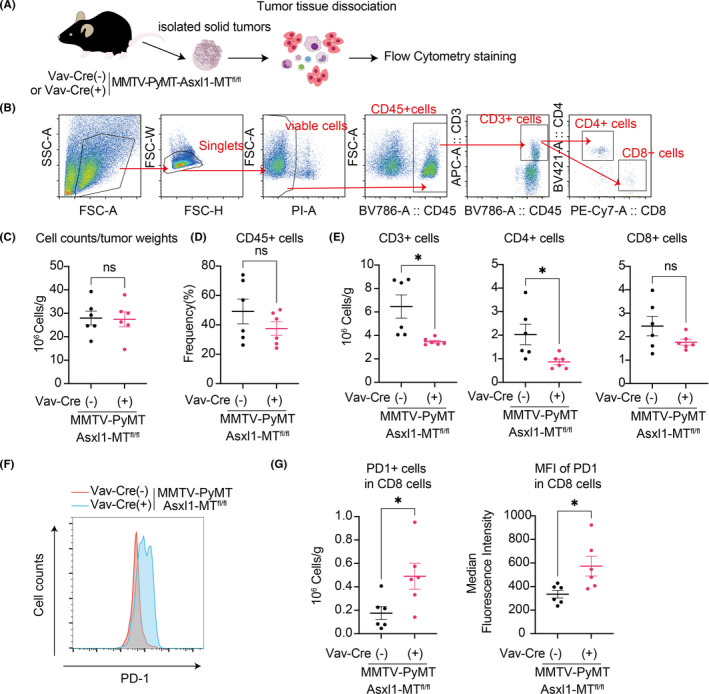
FIGURE 3.

Intratumor analysis in the MMTV‐PyMT mice. A, Schematic diagram of intratumor analysis using flow cytometry. B, The gating strategy of intratumor T cells. Mammary tumors were collected from the MMTV‐PyMT‐Asxl1‐MTfl/fl [Vav‐Cre(−)] mice and Vav‐Cre; MMTV‐PyMT‐Asxl1‐MTfl/fl [Vav‐Cre(+)] mice. C–E, Total cell numbers per gram of tumors (C); the frequency of infiltrated CD45+ cells (D); and numbers of tumor‐infiltrated CD3+, CD4+, and CD8+ T cells per gram of tumors (E). F, Representative FACS plots of PD‐1+ in tumor‐infiltrated CD8+ T cells. G, Numbers of PD1+ cells in tumor‐infiltrated CD8+ T cells per gram of tumors (left) and the median fluorescence intensity (right) are shown. Data are shown as mean ± SEM. Unpaired t test was used for the comparison
