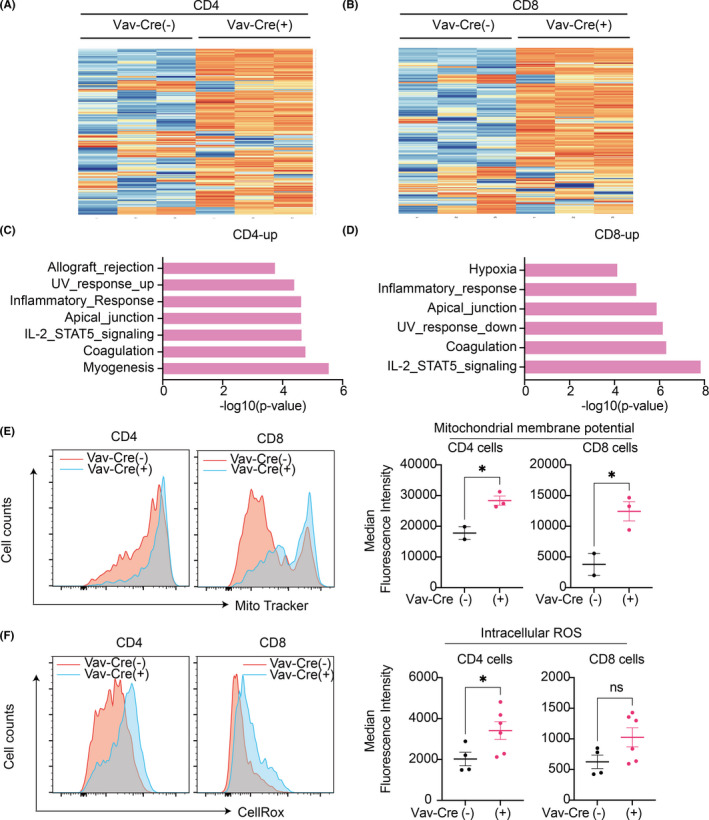
FIGURE 6.

Mutant ASXL1 induces inflammation and mitochondrial dysregulation in T cells. A, B, Hierarchical clustering of the RNA‐Seq data of CD4+ (A) and CD8+(B) T cells. Top 200 most viable genes and comparison of control [Vav‐Cre(−)] and Vav‐Cre; Asxl1‐MTfl/fl [Vav‐Cre(+)] mice are shown (n = 3 per group). C, D, Gene set enrichment analysis (GSEA) for upregulated genes in CD4+ (C) and CD8+ T (D) cells using the MSigDB. The x‐axis shows the p‐value (−log10). E, Mitochondrial membrane potential in CD4+ and CD8+ T cells of Asxl1‐MTfl/fl [Vav‐Cre(−)] (n = 2) and Vav‐Cre; Asxl1‐MTfl/fl [Vav‐Cre(+)] (n = 3). Representative histograms (left panel) and median fluorescence intensities (right panel) are shown. F, Intracellular reactive oxygen species (ROS) levels in CD4+ and CD8+ T cells of Asxl1‐MTfl/fl [Vav‐Cre(−)] (n = 4) and Vav‐Cre; Asxl1‐MTfl/fl [Vav‐Cre(+)] (n = 6) mice. Representative histograms (left panel) and median fluorescence intensities (right panel) are shown. Data are shown as mean ± SEM. Unpaired t test was used for the comparison
