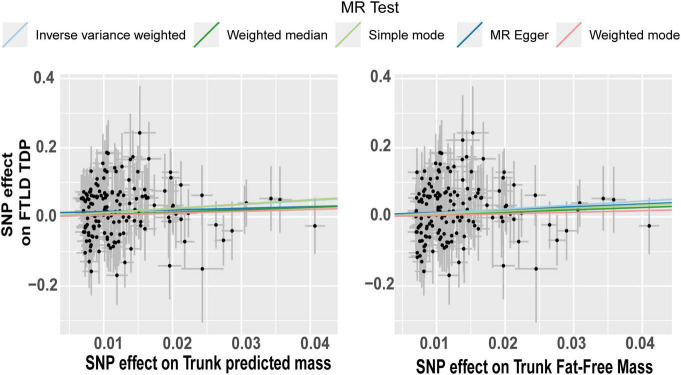
FIGURE 5.
Scatterplot of single nucleotide polymorphism (SNP) potential effects on trunk mass vs. frontotemporal lobar degeneration with TDP43. The slope of each line corresponds to the estimated Mendelian randomization (MR) effect per method. Significant changes in SNPs related to predict trunk mass and trunk fat-free mass are associated as a risk factor in FTLD TDP subtype.

