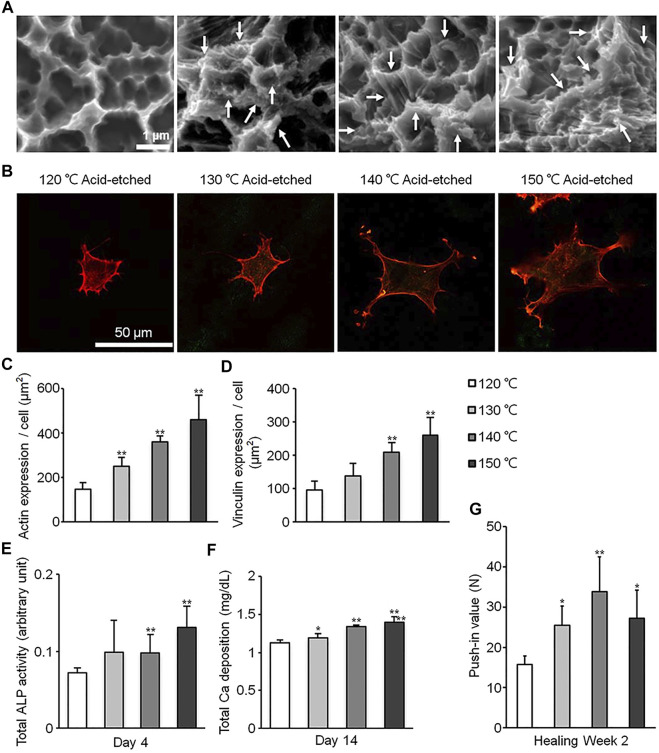
FIGURE 1.
Surfaces of different scales processed through acid etching at different temperature. (A) Scanning electron microscopy (SEM) photographs of surfaces in different groups. (B) Photographs of cells stained with rhodamine phalloidin. (C–G) Quantitative results of actin expression (C), vinculin expression (D), ALP activity (E), Ca deposition (F) and push-in value (G). Reprinted with permission from (Hasegawa et al., 2020).

