FIGURE 5.

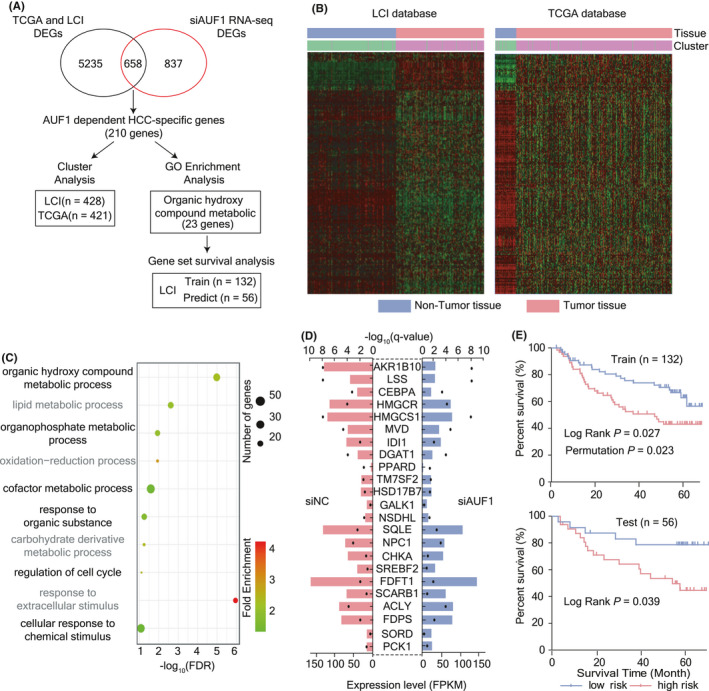
Screening of AUF1‐dependent HCC‐related genes. A, Analysis flow chart. DEGs indicates differentially expressed genes. B, Cluster analysis of HCC tissues and non‐tumor tissues using 210 AUF1‐dependent HCC‐specific genes for the LCI and TCGA HCC samples. C, Gene Ontology enrichment analysis of 210 AUF1‐dependent HCC‐specific genes. The color of the dot represents the fold enrichment, and the size of the dot represents the number of genes enriched in the pathway. D, Differential expression analysis of 23 AUF1‐dependent organic hydroxy compound metabolism genes in siAUF1 RNA‐seq. The length of bar represents fold change, and the black dot is used to indicate the q‐value. E, Survival gene set analysis of 23 AUF1‐dependent organic hydroxy compound metabolism genes for HCC in the LCI database. Log‐Rank indicates the log‐rank test P‐value, and permutation indicates the permutation test P‐value; in total 1000 random trials were conducted
