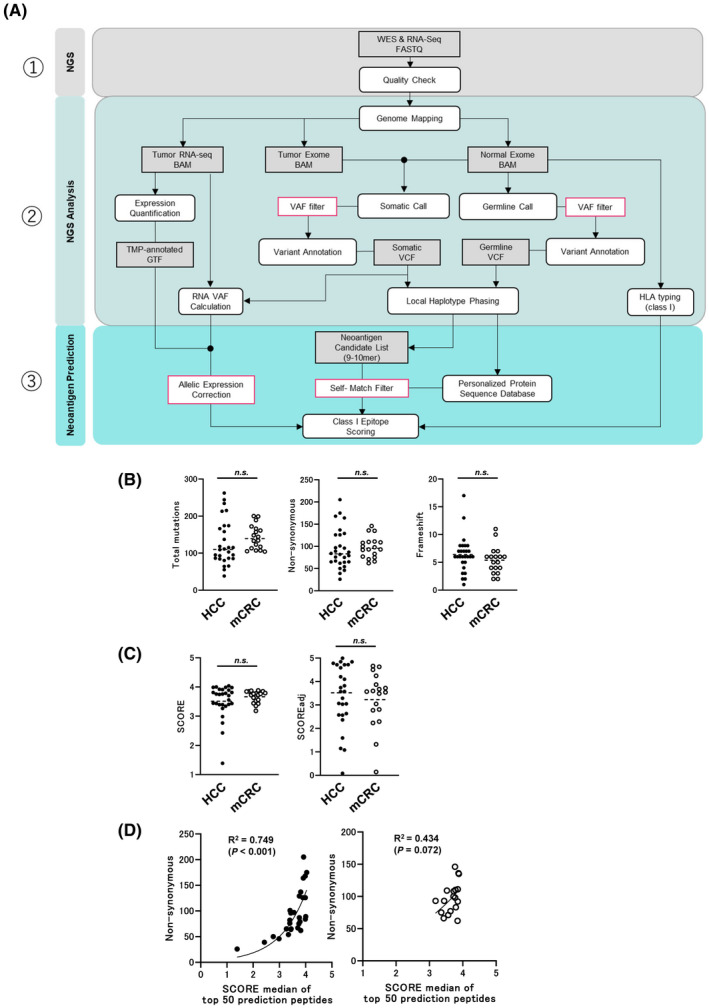
FIGURE 1.

(A) Schematic of the workflow described in the Materials and Methods. (B) Total, non‐synonymous, and frameshift mutations summarized from data in Table S1. (C) SCORE and SCOREadj summarized from data in Table S1 and S2. (D) Correlations between median SCOREs of top 50 prediction peptides and nonsynonymous mutations in patients
