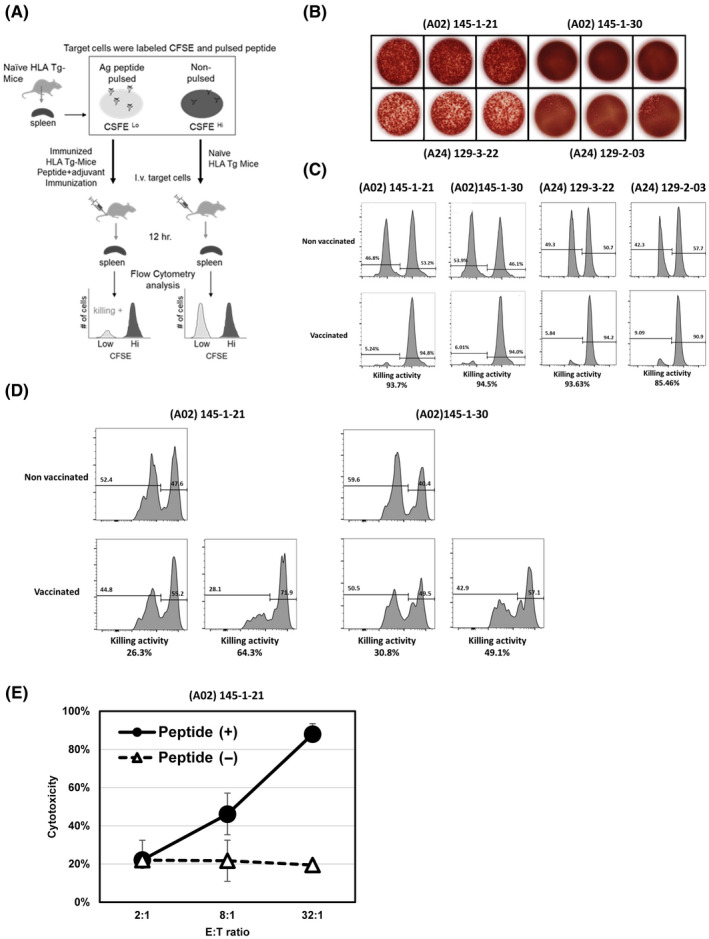
FIGURE 3.

In vitro and in vivo killing assays of induced immune response. (A) Protocol for in vivo killing assay. (B) The results of ELISpot assays illustrating the immune reactivity of (A02) 145‐1‐21, (A02) 145‐1‐30, (A24) 129‐3‐22 and (A24) 129‐2‐03 peptides that used for in vivo killing assay. (C) In vivo cytotoxicity measured in A02‐Tgm treated with 145‐1‐21 and 145‐1‐30 peptides (histograms, left side) and in A24‐Tgm treated with 129‐3‐22 and 129‐2‐03 peptides (histograms, right side). The target cells were syngeneic splenocytes pulsed with each peptide, respectively. (D) In vivo cytotoxicity measured in A02‐Tgm with 145‐1‐21 and 145‐1‐30 peptides using RMA‐HHD myeloma cells as targets. (E) In vitro killing assay targeting T2 cells pulsed with A02‐restricted 145‐1‐21 peptide. Cytotoxicity is shown as a percentage. Effector and target ratio (E:T ratio) gradually increased from 2:1 to 8:1 and to 32:1
