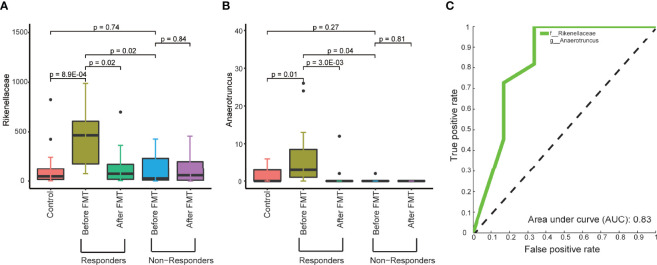
Figure 4.
The microbial abundance in pretreated fecal samples related to the response to FMT treatment. (A, B) Boxplots show the abundance of the family Rikenellaceae (A) and genus Anaerotruncus (B) in the fecal samples from control, responders, and nonresponders before and after FMT treatment. (C) ROC of the model trained to predict the response to FMT treatment based on the abundance of the family Rikenellaceae and the genus Anaerotruncus in pretreated fecal samples. The p-values within the responder and nonresponder groups were obtained by Mann–Whitney paired test, and p-values across groups were obtained by Mann–Whitney rank-sum test.

