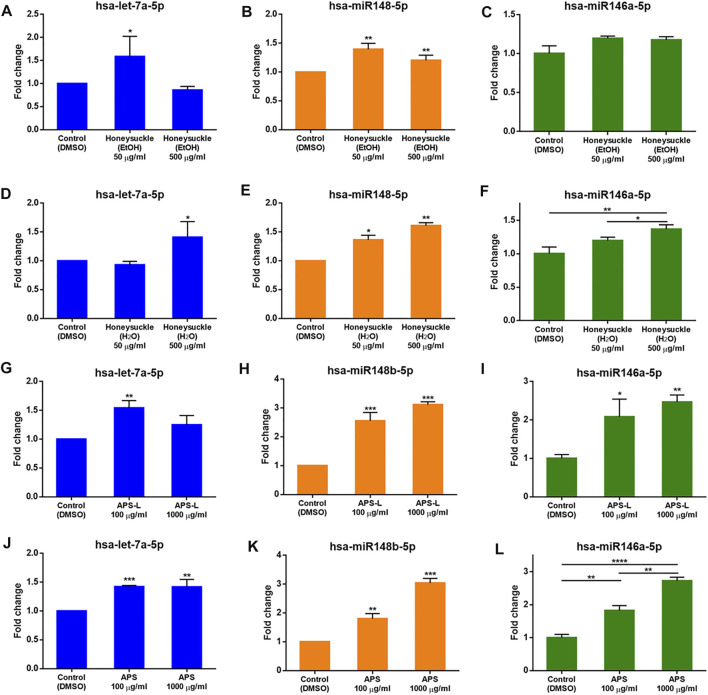
FIGURE 4.
Induction of let-7a, miR-148b, and miR-146a levels by the TCM candidates. let-7a, miR-148b, and miR-146a levels were measured by qRT-PCR normalized to the internal control U54 after a 24-h treatment with honeysuckle-EtOH (A-C), honeysuckle-H2O (D-F), APS-L (G-I), and APS (J-L). Data are expressed as mean ± SD from three repeated results and analyzed using Student’s t-test. *, significantly different from the corresponding control, at p < 0.05; **, p < 0.01; ***, p < 0.001.

