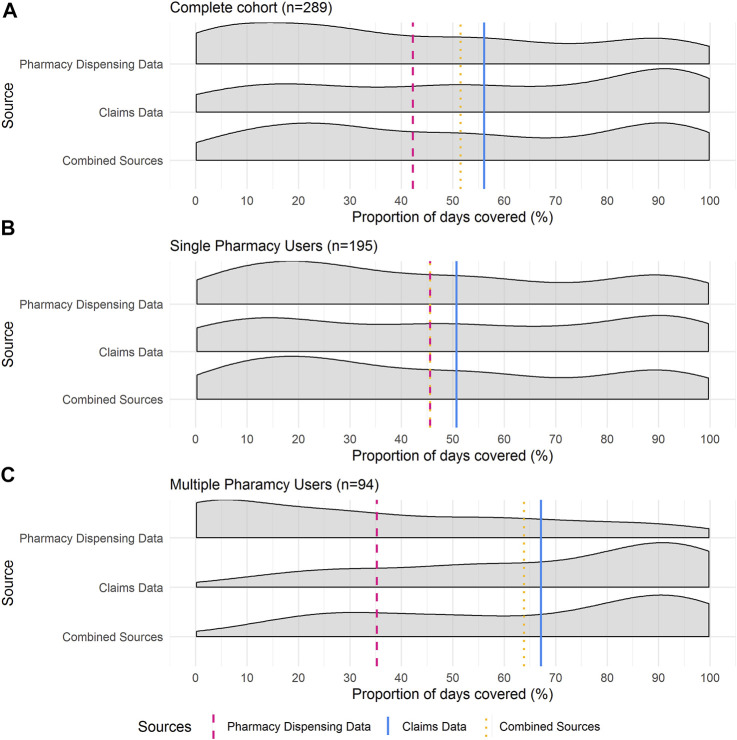
FIGURE 2.
Proportion of Days Covered (PDC) Density curves for (A) total cohort (n = 289), (B) single-pharmacy users (n = 195) and (C) multiple-pharmacy users (n = 94). Vertical lines are representative of mean PDC for each data source. These distribution plots illustrate the consistently larger PDC estimates calculated via claims records and the relative closeness in PDC estimates between the claim’s records and the combined claims records and pharmacy dispensing data.

