FIGURE 1.
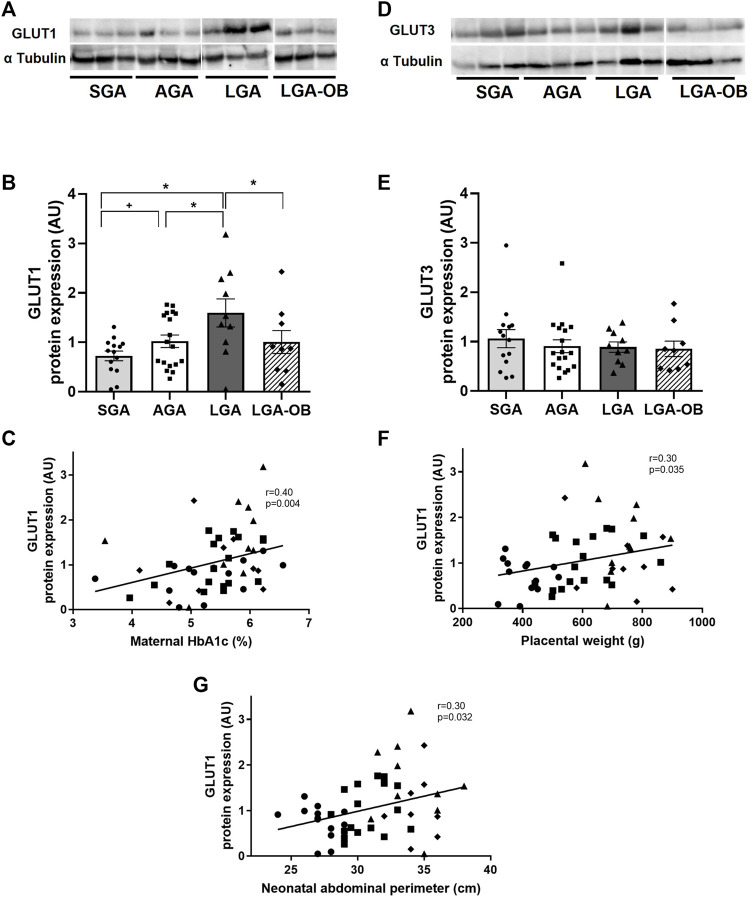
Protein expression of glucose transporters in placentas of SGA, AGA, LGA, and LGA-OB newborns. Representative Western blot of GLUT1 (A) and GLUT3 (D) in placentas of SGA (n = 14), AGA (n = 18), LGA (n = 10), and LGA-OB (n = 9) newborns. Bands presented correspond to the same membrane. Quantification of GLUT1 (B) and GLUT3 (E) protein expressions in the placenta by immunodetection. Data are mean ± SE. * denotes significant difference (p < 0.05) between groups by ANOVA. + denotes significant difference when compared to control AGA by Student´s t test. Correlation between the placental expression of GLUT1 with maternal HbA1c (C), placental weight (F), and neonatal abdominal perimeter (G).

