FIGURE 4.

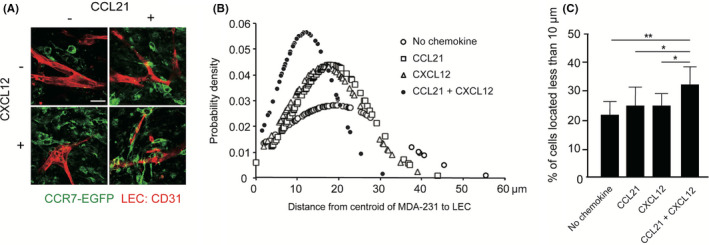
The effects of CXCL12 on MDA231 cell migration toward lymphatic vessels. A, The fluorescent images of CCR7‐1 cells (green) invading into tissues are shown. Lymphatic networks were visualized by immunostaining with anti‐CD31 antibody (red). Scale bar, 50 µm. B, Distribution of CCR7‐1 cells’ distance from the nearest lymphatic network is shown. In each sample, images including 100–150 cells (n = 5) were captured and subjected to the analysis. The results shown are representative of three independent experiments. C, The percentages of CCR7‐1 cells located less than 10 µm away from the nearest network are analyzed. Data represent the mean ± SD percentage from triplicate images of three independent experiments (one‐way ANOVA; *p < 0.05, **p < 0.01)
