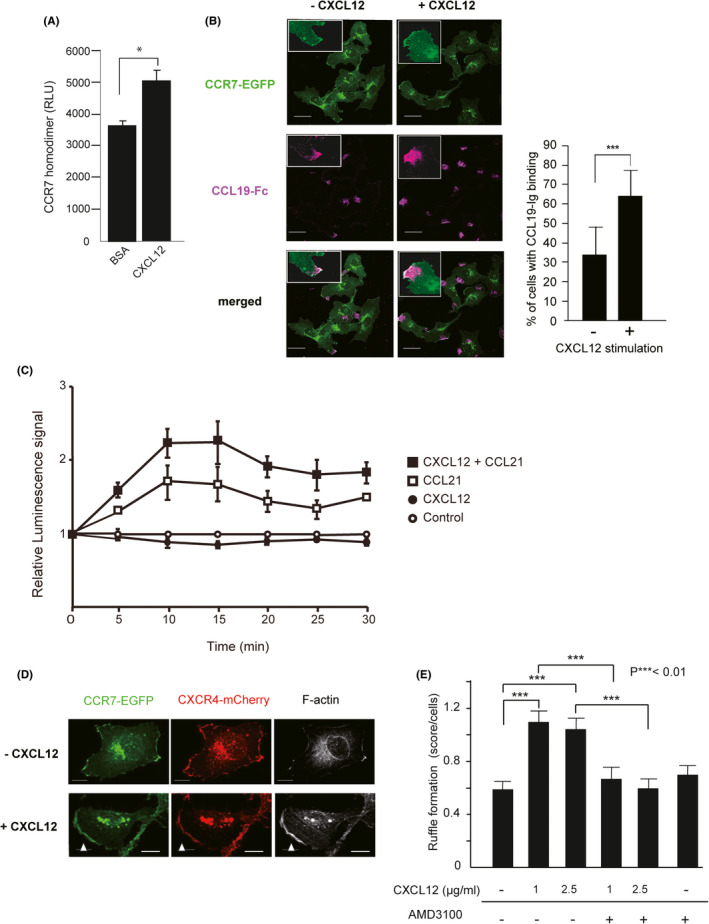
FIGURE 5.

The effects of CXCL12 on CCR7 homodimerization, ligand binding, and the plasma membrane localization. A, CCR7 homodimer formation after treatment with CXCL12 in MDA231 cells. The levels of bioluminescence signals are shown for cells transfected with combinations of CCR7‐CGLuc and CCR7‐NGLuc in the presence of BSA or CXCL12. A representative experiment from at least three independent experiments is shown. Data represent mean ± SD (n = 4). *p < 0.05 by Student's t test. B, Confocal microscopic images of MDA‐R7/X4 cells treated with or without CXCL12 for 30 min, fixed, and stained with recombinant CCL19‐Fc, biotin‐anti‐human IgG, and Alexa Fluor 647–conjugated streptavidin. The expressions of CCR7‐EGFP (green) and CCL19‐Fc (magenta) are shown. Insets show high magnification of membrane ruffles. The images were analyzed to obtain the percentage of the cells with CCL19‐Fc binding. Scale bar, 30 µm. ***p < 0.01 by Student's t test. C, Luciferase complementation assay using CCR7‐Nluc and β‐arrestin 2‐Cluc. CCL21 was added 30 min after treatment of cells with CXCL12 or a solvent, and the luminescence signal was measured at each time point indicated. Error bars indicate standard error of the mean. D, MDA‐R7/X4 cells were stimulated with or without CXCL12 for 30 min, fixed, and stained with Alexa647‐phalloidin. Fluorescence images were captured by a confocal microscopy. The expression of CCR7 (green), CXCR4 (red), and F‐actin (white) are shown. White arrowheads show CXCR4‐ and CCR7‐enriched membrane ruffles. Scale bar, 10 µm. E, The average score of CXCR4/CCR7‐enriched membrane ruffles of each cell. The cells were treated with the indicated concentrations of CXCL12 in the presence or absence of CXCR4‐specific antagonist AMD3100. The ruffling index was evaluated as 0 = no ruffles, 1 = ruffles covering less than 25% of the peripheral area, and 2 = ruffles covering more than 25% of the peripheral area. The statistical difference was determined by one‐way ANOVA and depicted with ***p < 0.01
