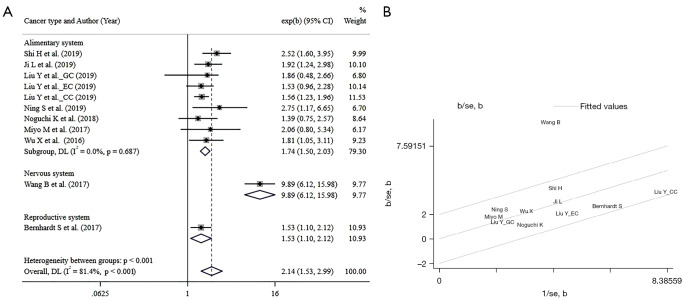
Figure 2.
The Forest plots and Galbraith radial plot of overall survival analysis: (A) the Forest plots of overall survival analysis; (B) Galbraith radial plot of overall survival analysis. GC, gastric cancer; EC, esophageal cancer; CC, colorectal cancer; CI, confidence interval; DL, DerSimoniar and Laird method; se, standard error.

