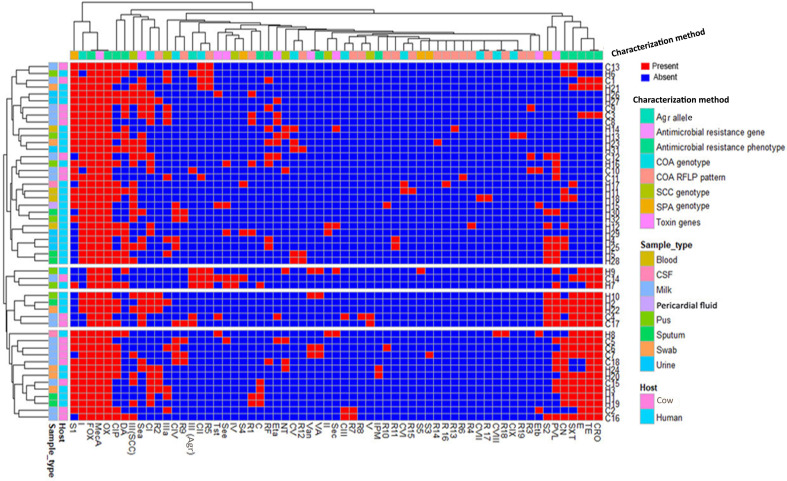
Figure 6.
Heatmap showing the hierarchical clustering and overall distribution of ST239-MRSA strains based on their genotypes and antimicrobial resistance and toxin gene profiles. Red and blue colors refer to presence and absence of a particular feature, respectively. The dendrogram represents the hierarchical clustering of the strains and various features. Different categories of characterization methods, sample types, and hosts are color-coded on the right of the heatmap. CIP, ciprofloxacin; RF, rifamycin SV; TE, tetracycline; CRO, ceftriaxone; E, erythromycin; C, chloramphenicol; VA, vancomycin; DA, clindamycin; SXT, trimethoprim‐sulfamethoxazole; CN, gentamicin; IPM, imipenem; CI–CIX, coagulase genotypes; R1–R19, coa-RFLP patterns; SCCmec (II, III, IV, and V), staphylococcal cassette chromosome mec; NT, non-typeable; agr (I and III), accessory gene regulator; S1–S5, spa PCR products; van, vancomycin resistance gene; pvl, Panton–Valentine leucocidin; sea, see, and sec, staphylococcal enterotoxins A, B, and C; tst, toxic shock syndrome toxin; eta and etb, exfoliative toxins A and B.

