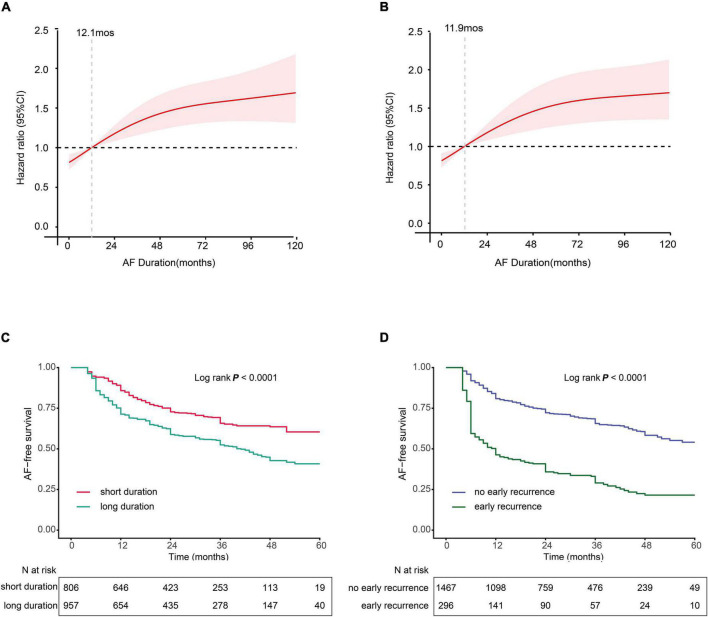
FIGURE 2.
(A,B) Multivariable-adjusted hazard ratios (HRs) for atrial fibrillation (AF) recurrence according to levels of AF duration on a continuous scale. (A) Paroxysmal AF and (B) non-paroxysmal AF. Red lines are multivariable-adjusted HRs, with pink areas showing 95% confidence intervals (CIs) derived from RCS regressions with four knots located at the 5th, 35th, 65th, and 95th percentiles. Reference lines for no association are indicated by the dashed gray lines at an HR of 1.0. Analyses were adjusted for age, smoking, sex gender, hypertension (HTN), estimating glomerular filtration rate (eGFR), coronary artery disease (CAD), diabetes mellitus (DM), early recurrence (ER), body mass index (BMI), left atrial dimension (LAD), and left ventricular ejection fraction (LVEF). (C,D) Kaplan–Meier curves show the incidence of recurrence. (C) Kaplan–Meier survival curves for long AF duration (LAFD), the cutoff points for AF duration 12 months in both non-paroxysmal AF and paroxysmal AF. (D) Kaplan–Meier survival curves for ER.

