Figure 1.
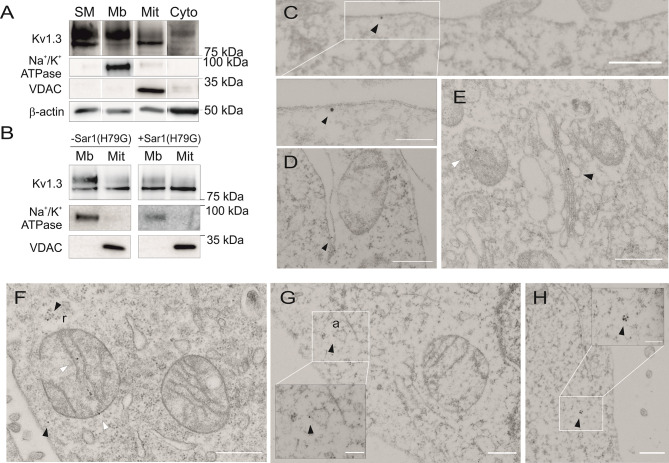
Kv1.3 is targeted to the mitochondria by bypassing the endoplasmic reticulum. (A) Subcellular fractionation to obtain the membranous (Mb), mitochondrial (Mit) and cytosolic (Cyto) fractions of HEK 293 cells transfected with Kv1.3YFP. SM, starting materials. Na+/K+ ATPase is used as a plasma membrane (PM) marker, and VDAC is used as a mitochondrial marker. β-actin identified cytosolic-enriched fractions. Note the difference in molecular weight of Kv1.3 bands from the Mb and Mit fractions. (B) Mb and Mit fractions of HEK 293 cells transfected with Kv1.3YFP were obtained. Cells were cotransfected with (+) or without (-) a constitutively active Sar1(H79G) dominant-negative GTPase. (C–H) Electron micrographs of HEK 293 cells transfected with Kv1.3YFP. Kv1.3 was labeled with 18 nm immunogold particles. Arrowheads indicate Kv1.3. (C) Plasma membrane Kv1.3. (D) Kv1.3 in the ER. (E) Kv1.3 in the Golgi (black arrowhead) and in the IMM (white arrowhead). (F–H) Black arrowheads indicate cytosolic Kv1.3, and white arrowheads indicate mitochondrial Kv1.3. Note the presence of Kv1.3 in ribosomes (r) close to a mitochondrion or embedded in the actin cytoskeleton (a) in (F, G), respectively. The scale bar indicates 500 nm. White square insets in (C, G, H) highlight higher magnification regions with a scale bar representing 200 nm.

