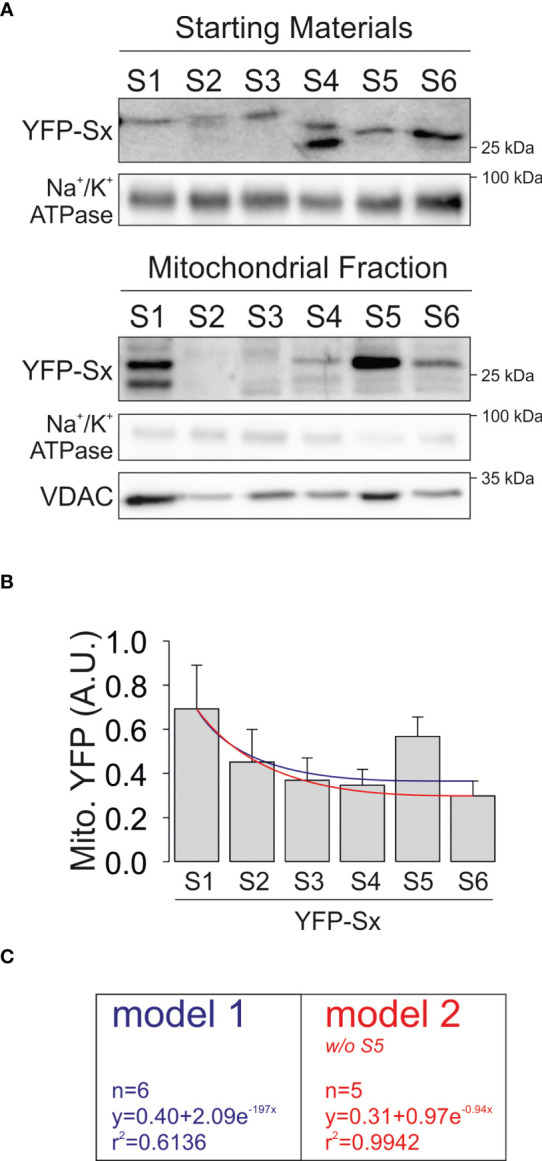
Figure 8.

Mitochondrial expression of YFP-Sx(1-6) transmembrane peptides. HEK 293 cells were transfected with several YFP-Sx(1-6) transmembrane peptides, and mitochondrial expression was studied. (A) Representative immunoblots showing purified mitochondrial fractions from total lysates (starting materials) and mitochondrial extracts (mitochondrial fractions). Samples were immunoblotted with antibodies against YFP (YFP-Sx(1-6)), Na+/K+ ATPase (membrane marker) and VDAC (mitochondrial marker). (B) Relative mitochondrial YFP-Sx expression is presented in arbitrary units (A.U.). Data are presented as the means ± SE (n=3-5). Blue line, nonlinear regression curve representing a monoexponential decay with all constructs. Red line, nonlinear regression curve representing a monoexponential decay without S5. Note that with slight variations, both lines represent a bona fide fitting of data. (C) Calculations of both fits. Model 1 (blue) includes values from all YFP-Sx and Model 2 (red) lacks S5.
