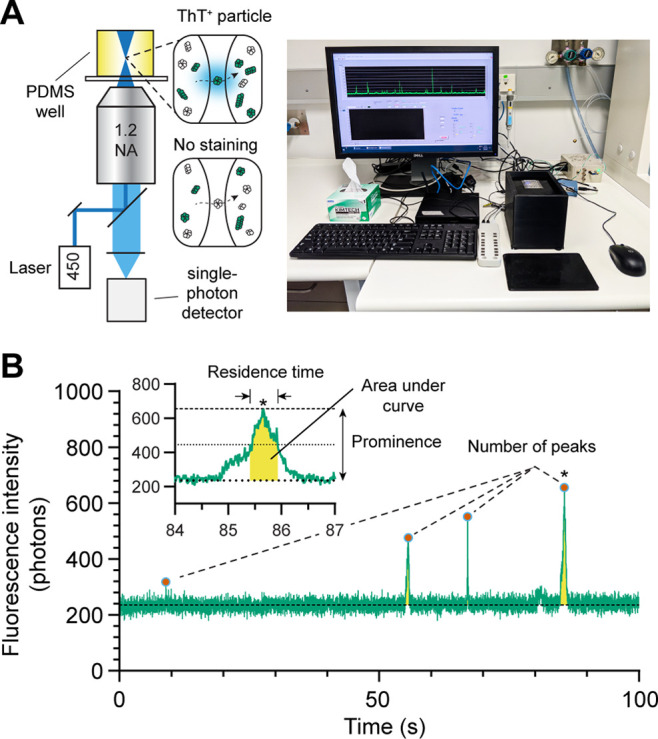
Figure 1.

Single molecule fingerprinting for the characterization of α-synuclein species. (A) (left) Schematic of the microscope setup. The inset shows ThT stained and unstained (dark) α-syn oligomers or fibrils (green and white colored particles) diffusing across the confocal volume. Monomeric α-syn and some assemblies do not bind ThT. (right) Photograph of the microscope for recording the fluorescence traces. (B) Characterization of fluorescence traces. A fluorescence trace is analyzed to report the total number of peaks (events) and the prominence of individual peaks, residence time (full width half-maximum), and area under the curve (yellow). The inset shows a region denoted by (*) in the trace.
