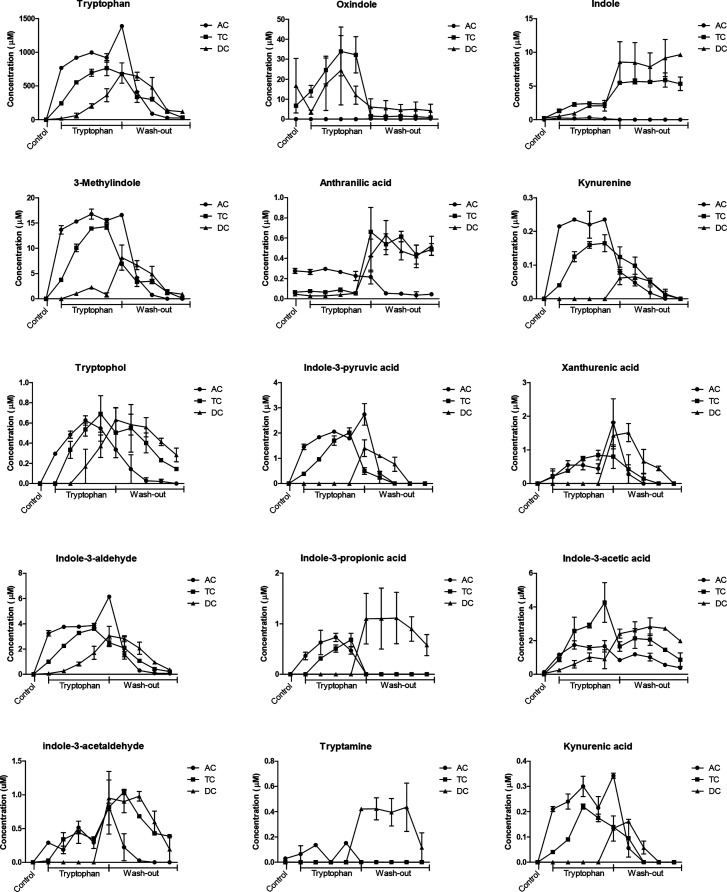
Figure 2.
Evolution of tryptophan and tryptophan metabolites concentration during control, tryptophan supplementation, and wash-out period, in the ascending (AC), transverse (TC), and descending colon (DC) during in vitro SHIME fermentation. n = 2 donors. Each data point represents the concentration at each day of the Trp supplementation and wash-out period. Only the last day of the control period is reported (first data point in the graph).

