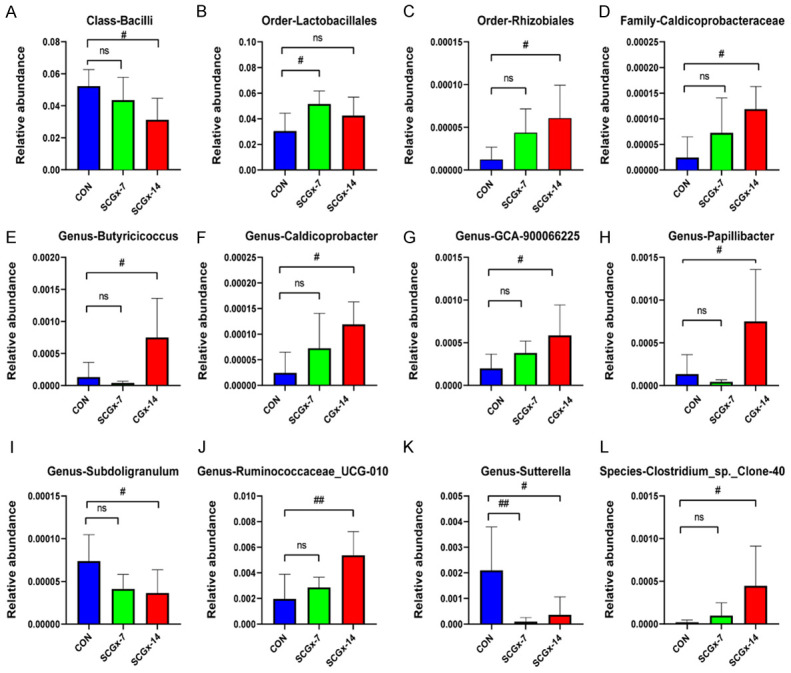
Figure 2.

The ANOVA analysis of gut bacteria at differential levels in CON, SCGx-7 and SCGx-14 groups. A. Class-Bacilli (P=0.036714). B. Order-Lactobacillales (P=0.040188). C. Order-Rhizobiales (P=0.030745). D. Family-Caldicoprobacteraceae (P=0.023132). E. Genus-Butyricicoccus (P=0.009982). F. Genus-Caldicoprobacter (P=0.023132). G. Genus-GCA-900066225 (P=0.044258). H. Genus-Papillibacter (P=0.039208). I. Genus-Subdoligranulum (P=0.0485). J. Genus-Ruminococcaceae_UCG-010 (P=0.006185). K. Genus-Sutterella (P=0.010417). L. Species-Clostridium_sp._Clone-40 (P=0.009404). #P<0.05, ##P<0.01. All three groups were compared by one-way analysis of variance with Dunnett’s multiple comparisons test.
