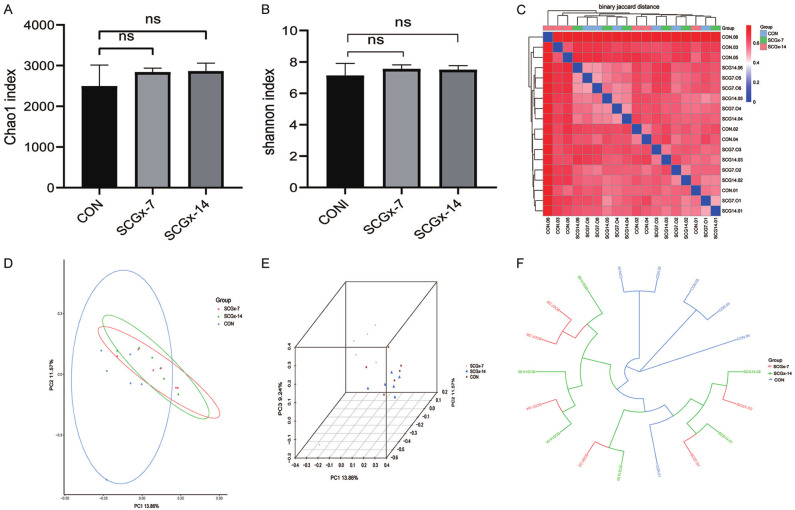
Figure 4.
The analysis of alpha-diversity and beta-diversity. A. Chao1 index (P>0.05). B. Shannon index (P>0.05). Data are shown as mean ± SEM (n=6). P values were calculated from the Wilcoxon rank sum test. C. Binary-Jaccard distance. D, E. Binary-Jaccard based Principal component analysis (PCoA) of the three groups. (P<0.05). P was calculated from the permutational multivariate analysis of variance. F. Unweighted UniFrac-based hierarchical clustering analysis of UPGMA in the three groups.

