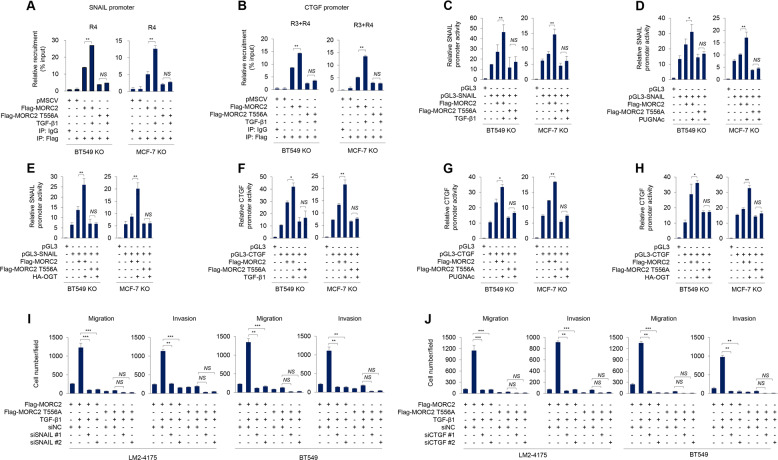
Fig. 6. O-GlcNAcylated MORC2 is recruited to SNAIL and CTGF promoters and enhances promoter activities of SNAIL and CTGF.
A, B MORC2-KO BT549 and MCF-7 cells stably expressing pMSCV or Flag-MORC2 (WT or T556A) were serum-starved for 24 h, and then treated with or without 5 ng/ml TGF-β1 for 24 h. ChIP assays were performed with an anti-Flag antibody or IgG, followed by qPCR analysis. Recruitment of Flag-MORC2 to the SNAIL (A) or CTGF (B) promoter was normalized to Input. **p < 0.01; NS, no significance. C, D, F, G MORC2-KO MCF-7 and BT549 cells stably expressing pMSCV or Flag-MORC2 (WT or T556A) were transfected with a luciferase reporter construct encoding pGL3, pGL3-CTGF (−901 to −2000) or pGL3-SNAIL ( + 100 to −500). After 24 h of transfection, cells were treated with or without 5 ng/ml TGF-β1 for 24 h (C and F) or 20 μM PUGNAc for 24 h (D and G). In D and G, cells were serum-starved for 24 h prior to TGF-β1 treatment. Luciferase assays were performed as described in Materials and Methods. Transfection efficiency was normalized to co-transfected Renilla (Ren) luciferase. Results represent three independent experiments. Error bars represent SEM. **p < 0.01; NS, no significance. E, H MORC2-KO MCF-7 and BT549 cells stably expressing pMSCV or Flag-MORC2 (WT or T556A) were co-transfected with or without a luciferase reporter construct encoding pGL3, pGL3-SNAIL ( + 100 to −500) (E) or pGL3-CTGF (−901 to −2000) (H) and HA-OGT. After 48 h of transfection, luciferase assays were performed as described above. The results are representative of three independent transfection experiments. Error bars represent SEM. **p < 0.01; NS, no significance. I, J MORC2-KO LM2–4175 and BT549 cells stably expressing Flag-MORC2 or Flag-MORC2 T556A were transfected with siNC or two siRNAs targeting SNAIL (siSNAIL) (Supplementary Fig. S10A) or CTGF (siCTGF) (Supplementary Fig. S10B). After 24 h of transfection, cells were serum-starved for 24 h, followed by treatment with or without 5 ng/ml TGF-β1 for 24 h. Transwell migration and invasion assays were performed as described in Materials and Methods. Corresponding quantitative results are shown in I-J. **p < 0.01. ***, p < 0.001; NS, no significance. Representative images of migrated and invaded cells are shown in Supplementary Fig. S10C and Fig. S10D.

