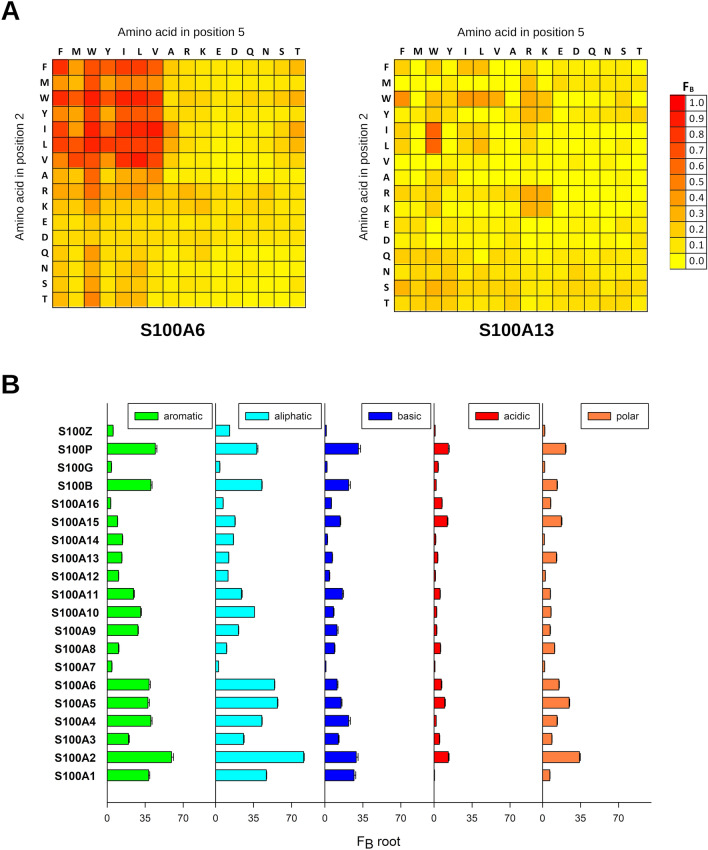
Figure 2.
The interaction between the H14 foldamer library and the S100ome measured by holdup (HU) assay. (Panel A) The interactions between S100 proteins and foldamers were measured by a high-throughput (HTP) holdup (HU) assay, as visualized in Fig. 1B. Bound fraction values were calculated based on the loss of intensity of the foldamer of interest in the flow-through fraction using Eq. (1) (see “Methods”); and were depicted as a heat map in linear scale for each S100 protein. FB ranges are color coded as shown on the right. The vertical axis and horizontal axis represents the β-amino acid in the second and fifth positions, respectively14. Some S100 members favored multiple fragments (e.g. S100A6 on the left), while multiple S100 proteins did not show clear binding preference towards the foldamer fragments (e.g. S100A13 on the right). (Panel B) S100 proteins exert different amino acid sidechain preference based on the HTP HU measurements. The amino acid preferences were calculated for all S100 proteins using Eqs. (3) and (4) (see “Methods”). SEM was calculated from the three individual FBroot values. Mean ± SEM were depicted as a bar chart. The residues with high frequency in the bound foldamers have hydrophobic properties as aromatic and aliphatic side chains are the most preferred ones. Importantly, due to the rather acidic nature of S100 proteins, acidic side chains are the least preferred among S100 proteins. It is noteworthy that in some instances polar residues are also favored (e.g. S100A2, S100A5).

