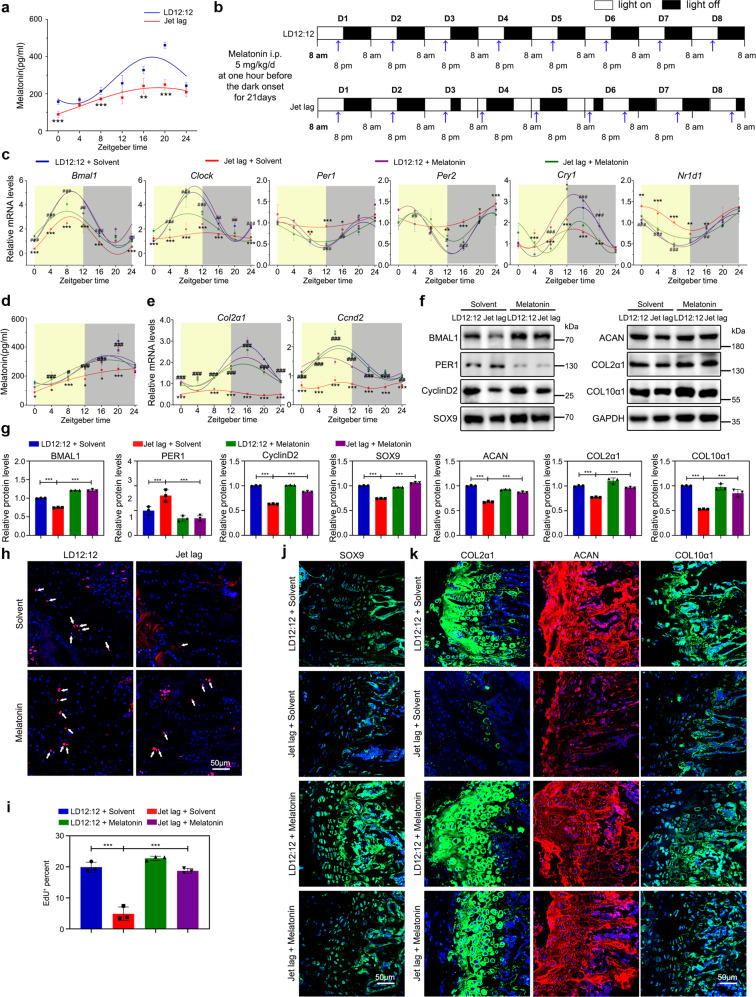
Fig. 4. Melatonin in serum confers MTR1-mediated circadian rhythm.
a Detect the level of melatonin in serum at different time points by ELISA, **P < 0.01, ***P < 0.001 (n = 3 per group). b The schematic shows the experiment schedule. Blue arrowheads indicate the time of injection at one hour before the dark onset. c qRT-PCR analysis of the mRNA levels of Bmal1, Clock, Per1, Per2, Cry1, and Nr1d1 in the growth plate cartilages from LD12:12 or jet-lagged mice treated with equal solvent or melatonin (Sigma, M5250, 5 mg/kg/d, injected before the dark onset for 21 days, jet-lagged mice were pretreated with jet lag for 2 weeks before the melatonin injection) at the indicated time (n = 3 per group). *P < 0.05, **P < 0.01, ***P < 0.001, LD12:12 compared with the Jet lag. #P < 0.05, ##P < 0.01, ###P < 0.001, melatonin compared with equal solvent in jet-lagged mice. d ELISA analysis of the level of melatonin in serum at different time points after melatonin injection. e qRT-PCR analysis of the mRNA levels of Col2α1 and Ccnd2 in the growth plate cartilages of LD12:12 and jet-lagged mice treated with equal solvent or melatonin at indicated time (n = 3 per group). f, g Western blot analysis of the levels of BMAL1, PER1, CyclinD2, SOX9, ACAN, COL2α1, and COL10α1 in the femoral metaphysis tissue from LD12:12 or jet-lagged mice treated with equal solvent or melatonin, ***P < 0.001 (n = 3 per group). h, i EdU staining analysis of proliferating cells in PZ from the growth plate cartilages in LD12:12 and jet-lagged mice with melatonin or equal solvent, Arrowheads indicate EdU+ cells (n = 3 for each bar). Scale bar, 50 μm. j, k Immunofluorescence of SOX9, COL2α1, ACAN, and COL10α1 in the growth plate cartilages from LD12:12 and jet-lagged mice with melatonin or equal solvent at ZT10. Scale bars, 50 μm. g, i Data were analyzed using one-way ANOVA with Tukey multiple comparisons test.

