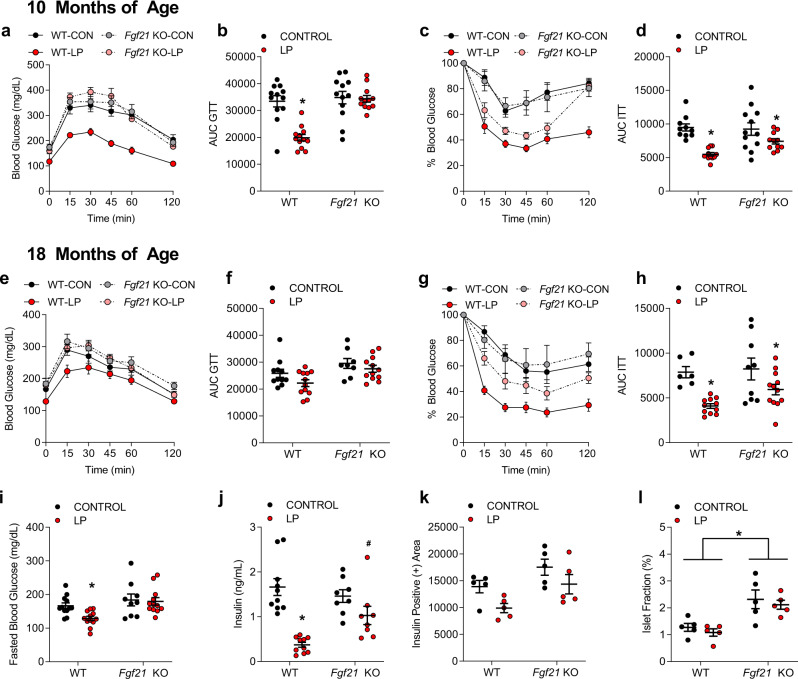
Fig. 4. FGF21 mediates low protein-induced improvements in glucose homeostasis in aged mice.
a Glucose tolerance test measured at 10 months of age in WT and Fgf21 KO mice control or LP diets (n = 8–12 mice/group, group*time p = 0.001). b Area under the curve glucose as measured in the GTT at 10 months of age (n = 8–12 mice/group geno*diet p = 0.001). c Insulin tolerance test at 10 months of age (n = 8–12 mice/group, group*time p = 0.001). d Area under the curve glucose as measured in the ITT at 10 months of age (n = 8–12 mice/group; diet p = 0.001). e Glucose tolerance test measured at 18 months of age in WT and Fgf21 KO mice control or LP diets (n = 8–12 mice/group group*time p = 0.236). f Area under the curve glucose as measured in the GTT at 18 months of age (n = 8–12 mice/group) geno p = 0.004, diet p = 0.062. g Insulin tolerance test at 18 months of age (n = 8–12 mice/group group*time p = 0.001). h Area under the curve glucose as measured in the ITT at 18 months of age (n = 8–12 mice/group; diet p = 0.003). i Fasting blood glucose at 18 months of age (n = 8–12 mice/group; diet p = 0.06, geno p = 0.0031, geno*diet p = 0.128). j Serum insulin levels at sacrifice at 22 months of age (n = 8–12 mice/group; geno*diet p = 0.01). k Insulin positive area as measured via insulin IHC on fixed pancreas collected at sacrifice at 22 months of age (n = 5 mice/group; geno p = 0.001, diet p = 0.02). l Islet fractional percentage as measured on fixed pancreas collected at sacrifice at 22 months of age (n = 5 mice/group; geno p = 0.01). Statistical analyses were conducted using one or two-way ANOVA. All values are mean ± SEM, with significant posthoc comparison within the diet*genotype interaction noted as *p < 0.05, #p < 0.10 compared with respective control. Source data are provided as a Source Data file.

