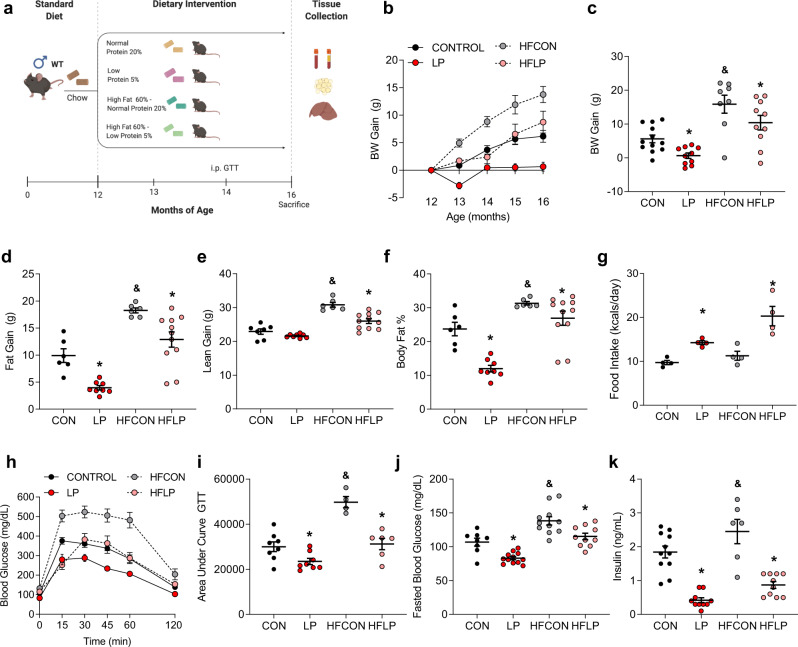
Fig. 7. Protein restriction promotes beneficial metabolic effects and protects against diet-induced obesity when initiated at middle age.
a Schematic representation of middle-aged study. Wildtype and Fgf21-KO mice were placed on CON, LP, HFCON, or HFLP diet at 12 months of age, with various metabolic endpoints assessed throughout the study as indicated and tissue collection at 16 months of age. b Body weight gain from initiation of diets (n = 12 mice/group). c Body weight gain from diet initiation to sacrifice at 16 months of age (n = 8–12 mice/group; fat p < 0.0001, protein p = 0.0046, fat*protein p = 0.8814). d Body fat gain from diet initiation to sacrifice at 16 months of age, as measured by NMR (n = 6–12 mice/group; fat p < 0.0001, protein p < 0.0001, fat*protein p = 0.816). e Body lean gain from diet initiation to sacrifice at 16 months of age, as measured by NMR (n = 6–12 mice/group; fat p = 0.001, protein p = 0.001, fat*protein p = 0.0144. f Percent body fat at sacrifice at 16 months of age (n = 6–12 mice/group; fat p < 0.0001, protein p < 0.0001, fat*protein p = 0.218). g Average daily food intake throughout the experiment (n = 4 cages/group fat p = 0.6676, protein p = 0.0001, fat*protein p = 0.285). h Glucose tolerance test conducted at 14 months of age (2 months on diet (n = 6–8 mice/group; group*time p = 0.001). i Area under the curve glucose for the GTT at 14 months of age (n = 6–8 mice/group fat*protein p = 0.01). j Fasting blood glucose at 14 months of age (n = 6–8 mice/group; fat p = 0.0001, protein p = 0.0001, fat*protein p = 0.94). k Serum insulin levels at sacrifice at 14 months of age (n = 6–8 mice/group; fat p = 0.0033, protein p = 0.0001, fat*protein p = 0.4746). Statistical analyses were conducted using two-way ANOVA with dietary fat content and dietary protein content as main effects. All values are mean ± SEM, with significant main effects of protein or posthoc comparisons within the fat*protein interaction noted as *p < 0.05 vs respective control, and main effects of fat noted as &p < 0.05 HFCON vs CON. Source data are provided as a Source Data file.

