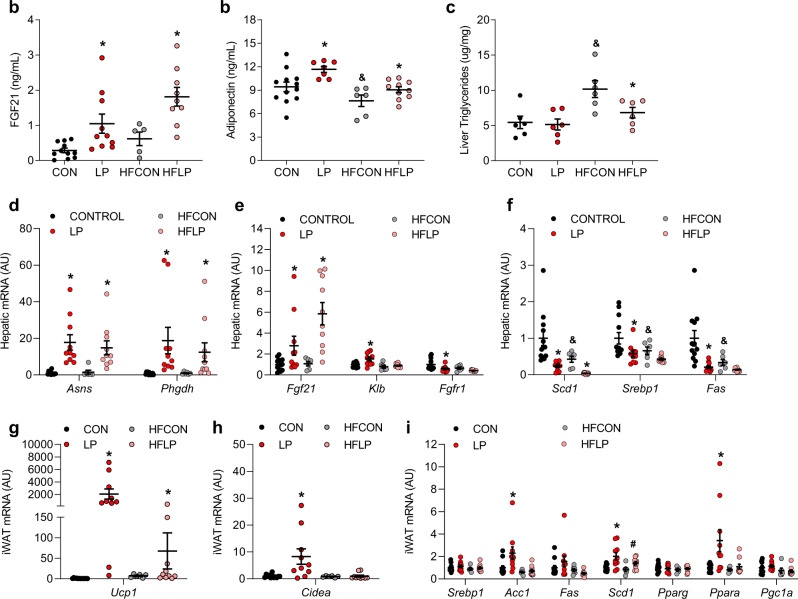
Fig. 8. Serum, liver, and adipose tissue endpoints following the initiation of dietary protein restriction in middle age.
a Serum FGF21 concentrations in wildtype and Fgf21-KO mice consuming control or LP diet from 12 to 16 months of age as Fig. 7a (n = 6–10 mice/group; protein p = 0.0002). b Serum Adiponectin concentrations at 16 months of age (n = 6–10 mice/group; fat p = 0.0007, protein p = 0.004). c Liver triglyceride content at 16 months of age (n = 6–10 mice/group; fat p = 0.0023, protein p = 0.06, fat*protein p = 0.11). d Liver amino acid biosynthetic gene expression (markers of dietary protein restriction) as measured via qPCR at 16 months of age (n = 6–10 mice/group; Asns protein p = 0.003, Phgdh protein p = 0.02). e Liver mRNA expression of FGF21 signaling genes as measured via qPCR at 16 months of age (n = 6–10 mice/group; Fgf21 protein p = 0.01, Klb fat p = 0.001, protein p = 0.01, fat*protein p = 0.08, Fgfr1 fat p = 0.04, protein p = 0.01) f Liver mRNA expression of lipogenic genes as measured via qPCR at 16 months of age (n = 6–10 mice/group, Scd1 fat p = 0.008, protein p = 0.0002, Srebp1 fat p = 0.04, protein p = 0.009, Fas fat p = 0.01, protein p = 0.001). g iWAT expression of Ucp1 at 16 months of age (n = 6–10 mice/group; fat*protein p = 0.02). h iWAT expression of Cidea at 16 months of age (n = 6–10 mice/group; fat*protein p = 0.03). i iWAT expression of metabolic genes at 16 months of age (n = 6–10 mice/group; Srebp1 p = NS, Acc1 fat*protein p = 0.08, Fas fat p = 0.04, Scd1 fat p = 0.08, protein p = 0.008, Pparg p = NS, Ppara fat*protein p = 0.06, Pgc1a fat p = 0.03). Statistical analyses were conducted using two-way ANOVA. All values are mean ± SEM, with significant main effects of protein or posthoc comparison within the fat*protein interaction noted as *p < 0.05 vs respective control and main effects of fat noted as &p < 0.05 HFCON vs CON. Source data are provided as a Source Data file.

