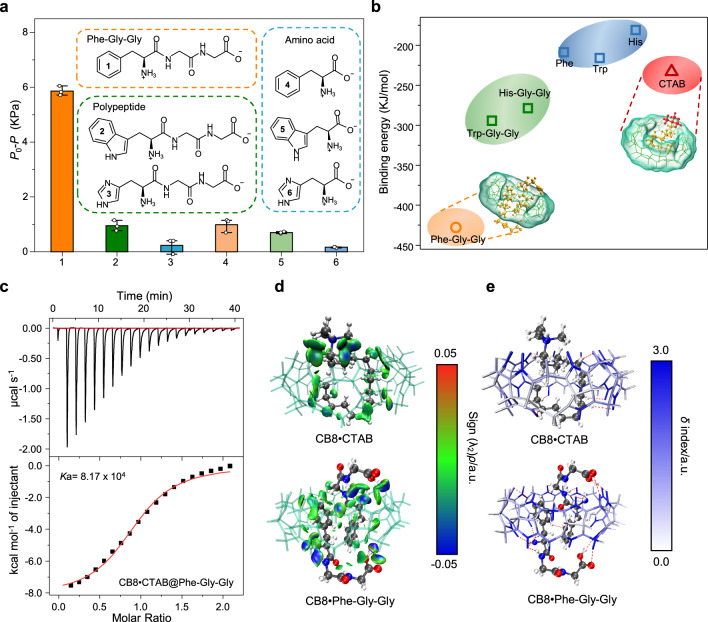
Fig. 3. Competitive binding mechanisms with CB8•CTAB.
a Selectivity of the HG-LGS with various molecules: (1) Phe-Gly-Gly; (2) Trp-Gly-Gly; (3) His-Gly-Gly; (4) Phe; (5) Trp; and (6) His. b Plots of the binding energy between CB8 and various guest molecules. c ITC data for CB8•CTAB complexation with Phe-Gly-Gly at 25 °C in 10 mM phosphate buffer, pH = 7.0. d δginter = 0.01 a.u. isosurfaces colored by the sign of (λ2)ρ for the CB8•CTAB and CB8•Phe-Gly-Gly complexes. Blue represents strong attraction, green represents van der Waals forces, and red represents strong repulsion. e Atoms of CB8 colored based on their contribution to binding with CTAB and Phe-Gly-Gly. Gray represents no contribution to the complexation, while blue represents the largest relative contribution. Error bars represent standard deviations (n = 3).

